How Much Do Fees Actually Cost Over 30 Years?
Fee calculators show one number from one assumed return. This uses real historical outcomes and separates the fee you paid from what it actually cost you.
Every fee calculator currently ranking for this question does the same thing: assume a flat 7% annual return, apply a fee, show the difference in ending dollars. A typical example — $100,000 growing for 30 years reaches $761,226 fee-free, $574,349 after a 1% fee. That is a real, correct calculation. It is also the only calculation any of them run.
Two things are missing. First, 7% every year for 30 years never actually happened — real markets have distributions, not constants, and this site has the rolling-window machinery already built to show the real one. Second, and more useful: none of these calculators separate the fee dollars you actually paid from what those dollars would have earned had they stayed invested. That gap — not the fee itself — is the real content of “fees compound too.”
What the real historical range looks like
Same validated 60/40 series as posts 12 and 13, same 840 overlapping real 30-year windows. Per dollar invested as a lump sum:
| Annual fee | p10 | Median | p90 | vs. fee-free median |
|---|---|---|---|---|
| Fee-free | $8.90 | $13.15 | $23.29 | — |
| 0.03% (low-cost index fund) | $8.82 | $13.04 | $23.08 | −0.9% |
| 0.40% (average fund today, ICI 2025) | $7.89 | $11.66 | $20.65 | −11.3% |
| 1.00% (typical advisor AUM fee) | $6.58 | $9.73 | $17.23 | −26.0% |
| 1.50% (high-cost fund or wrap product) | $5.65 | $8.36 | $14.80 | −36.5% |
The 1% row’s −26.0% is close to the calculator example above (−24.6%), which is a useful sanity check on both. But it is a median standing in for a p10-to-p90 range that spans $6.58 to $17.23 — a 2.6× spread driven entirely by which 30 years you happened to invest through, something no flat-rate calculator can show because it only ever computes one path.
The fee you paid is not the cost
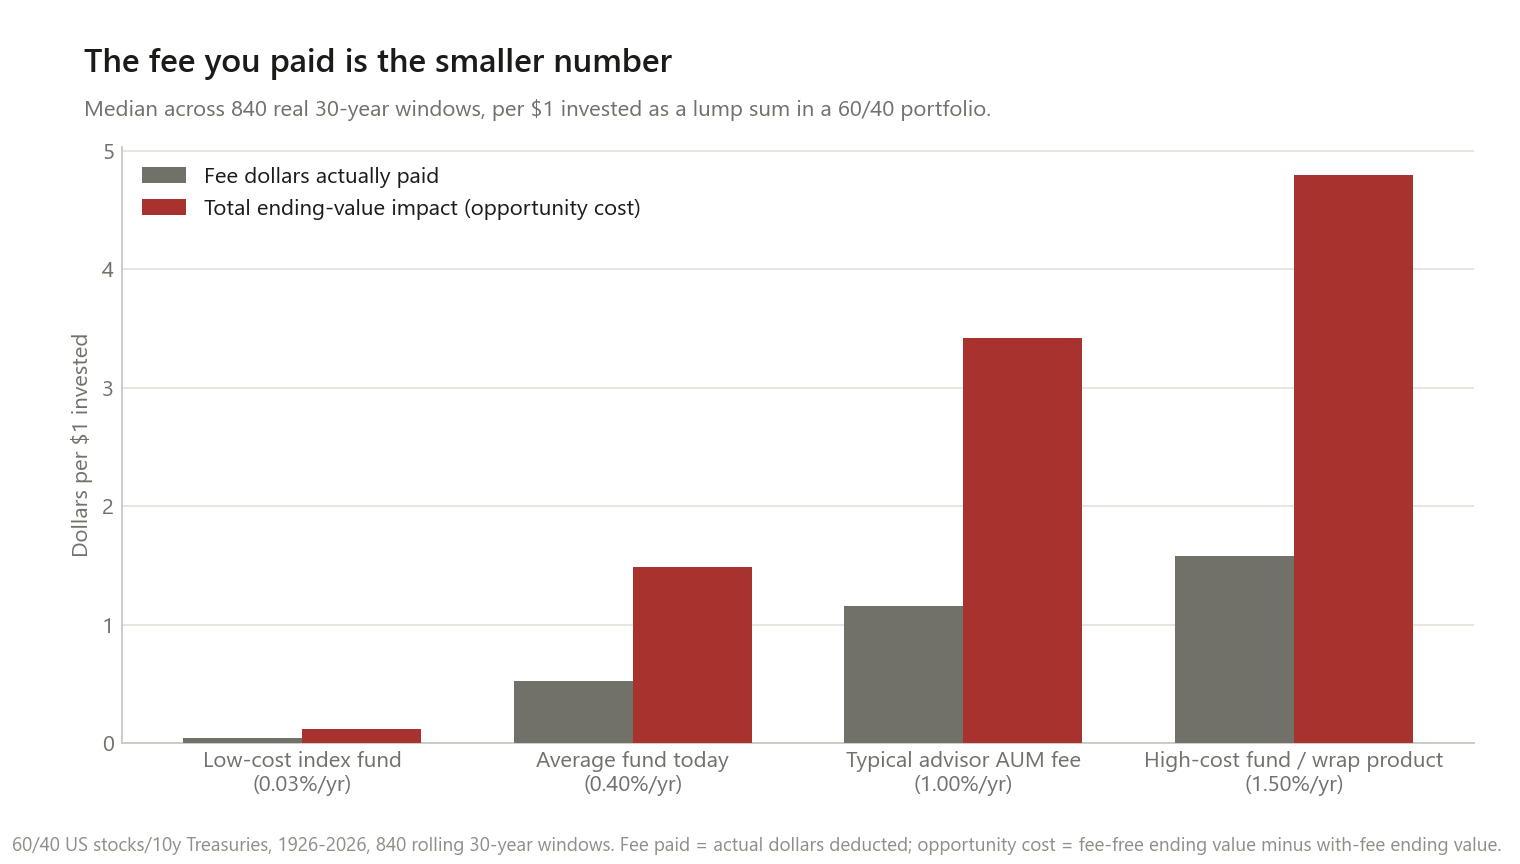
Here is the number the calculators skip. For each fee level, this tracks two different things across the same 840 windows: the actual fee dollars deducted from the account, and the gap between the fee-free ending value and the with-fee ending value — what those dollars would have become had they stayed invested and kept compounding.
| Annual fee | Fees paid (median) | Opportunity cost (median) | Ratio |
|---|---|---|---|
| 0.03% | $0.042 | $0.118 | 2.75× |
| 0.40% | $0.523 | $1.490 | 2.81× |
| 1.00% | $1.158 | $3.424 | 2.93× |
| 1.50% | $1.576 | $4.795 | 3.03× |
For every dollar you actually paid in fees, the real cost to your ending wealth was about 2.75 to 3 dollars — and that ratio barely moves across a 50× range of fee levels. It is not that higher fees are proportionally worse per dollar collected; it is that any dollar taken out of a compounding account early loses the rest of its compounding life, and that loss is worth roughly three times the dollar itself over a 30-year horizon, almost regardless of the fee rate charged. The range across the 840 windows (2.2× to 3.9× at the 1% level) tracks how strong the market was after the fee was taken — the multiplier is larger in windows with more growth left to miss out on.
Savers get hit differently than a lump sum
The numbers above assume money invested all at once on day one. Someone contributing to a retirement account is doing the opposite — putting money in gradually, with more of the total arriving in the later years. Same fee levels, same 840 windows, now contributing $1 a year (real terms) for 30 years instead of investing a lump sum:
| Annual fee | Ending balance (median, per $1/yr contributed) | vs. fee-free | Fees paid : opportunity cost |
|---|---|---|---|
| Fee-free | $82.46 | — | — |
| 0.03% | $81.97 | −0.6% | 2.17× |
| 0.40% | $76.34 | −7.4% | 2.20× |
| 1.00% | $67.85 | −17.7% | 2.23× |
| 1.50% | $61.62 | −25.3% | 2.26× |
Two things move in the same direction here, and it is worth being precise about which is which. The percentage hit to ending wealth is smaller for a saver than for a lump sum at every fee level (−17.7% vs. −26.0% at 1%) — because a growing contribution stream keeps adding fresh, not-yet-eroded money every year, while 100% of a lump sum is exposed to the fee for the full 30 years starting on day one. But the fees-paid-to-opportunity-cost ratio is also smaller and flatter (about 2.2× versus 2.75–3×) — because a larger share of a saver’s total fee dollars gets extracted from later, larger contributions that were never going to compound for very long anyway. Both effects have the same root cause: later money has less compounding life left, whether you are measuring what a fee removes or what it would have grown into.
What this does to the 4% rule
Post 12 found a 5.1% historical failure rate for a 60/40 portfolio at a 4% withdrawal rate, fee-free. Running the same 840 windows with a fee layered on top of the withdrawal:
| Annual fee | 4% rule failure rate |
|---|---|
| Fee-free (post 12 baseline) | 5.1% |
| 0.03% | 5.8% |
| 0.40% | 7.1% |
| 1.00% | 13.7% |
| 1.50% | 20.4% |
A 1% advisor fee nearly triples the historical failure rate of the 4% rule, from 5.1% to 13.7%. A 1.5% fee quadruples it. Fees do not just shrink the ending number on a lump sum — they eat directly into the withdrawal cushion that post 12 measured, because every month the account pays its fee before it pays the retiree.
Checked against a different post, a different method
The dividend-tax-drag post found a 0.79-percentage-point annual tax drag cost 19.4% of terminal value over 30 years, using dividend-fund data and IRS tax tables — a completely different dataset and method from this one. Running the identical 0.79% figure as a fee through this post’s 60/40 rolling-window engine gives a median terminal value drop of 21.2%. Two independent methods, 1.8 percentage points apart. That is not a coincidence to make much of, but it is a useful check: an annual percentage-point drag costs roughly the same regardless of whether it is labelled a fee or a tax.
What this does and doesn’t change
It does not mean a 1% fee is automatically a bad deal. Some of what an advisor or active fund charges for may be worth more than its cost — behavioural coaching, tax management, access to something a self-directed low-cost portfolio does not provide. This measures the cost, not the value received for it. It also isn’t the only thing that separates two similar portfolios: among real balanced funds holding roughly the same 60/40 mix, the middle-of-the-pack spread in realised returns was 1.12pp a year over three decades — bigger than most of the fee gaps on this page.
It does mean “the fee is only 1%” understates the number that matters. The relevant comparison is not 1% versus 0%; it is $1 paid versus roughly $3 lost, compounded over decades, and — for a retiree — a historical failure rate that nearly triples.
It does mean fee comparisons should specify lump sum or contribution stream. The same fee rate produces a meaningfully different relative hit and a different fees-paid-to-cost ratio depending on which one you are running, because both depend on how much compounding time the fee dollars actually had left.
Method notes and limitations
- Fee convention: applied as a monthly multiplicative haircut,
(1 − fee)^(1/12), to the combined portfolio value every month — equivalent in effect to a fund’s expense ratio being deducted from NAV continuously. Front-loaded sales charges, trading costs, and bid-ask spread are not modelled. - Fee levels are illustrative reference points, not a claim about what any specific product charges today. 0.40% is a real, cited figure (ICI’s 2025 asset-weighted average across equity mutual funds); 0.03%, 1.00% and 1.50% are commonly-cited industry benchmarks, not point-sourced to one filing.
- 60/40, annual rebalancing, no taxes — the same conventions as posts 9, 12 and 13, kept for direct comparability across the cluster. A different asset mix or account type (taxable vs. tax-deferred) would shift the exact multipliers.
- 840 overlapping windows, not 840 independent trials — as established in post 13, the 100-year sample contains only about three independent 30-year eras. Treat the ranges here as descriptive of one realised century, not a large-sample statistical estimate.
- The post-7 cross-check uses a different underlying dataset and time period (dividend funds and IRS tax tables vs. this post’s 60/40 series), so the 1.8-point gap reflects genuine methodological differences, not measurement error in either post.
- $1 normalisation: multiply every dollar figure in this post by your own actual starting balance or annual contribution to get your own numbers.
This is research, not personalised financial advice.
The code
The fee mechanic, added to the same simulation engine posts 12 and 13 already use:
def simulate(stock_r, bond_r, infl_r, weight_stock, swr, months=360, fee=0.0):
    fee_factor = (1.0 - fee) ** (1.0 / 12.0)
    ...
    fee_paid = np.zeros(n)
    for yr in range(years):
        ...
        for m in range(12):
            i = yr * 12 + m
            s_pre = s_bal * (1.0 + stock_r[:, i])
            b_pre = b_bal * (1.0 + bond_r[:, i])
            s_bal, b_bal = s_pre * fee_factor, b_pre * fee_factor
            # the dollars the fee actually removed this month, tracked separately
            # from what they would have grown into -- that gap is the whole post
            fee_paid = fee_paid + np.where(alive, (s_pre + b_pre) - (s_bal + b_bal), 0.0)
            cum_infl = cum_infl * (1.0 + infl_r[:, i])
        balance = s_bal + b_bal
    ...
    return {..., "fee_paid": fee_paid}


# opportunity cost = what fee-free ending value beats with-fee ending value by
opportunity_cost = simulate(..., fee=0.0)["end_ratio"] - simulate(..., fee=0.01)["end_ratio"]
ratio = opportunity_cost / simulate(..., fee=0.01)["fee_paid"]   # -> ~2.9x at 1%
Data: the same Ken French / constructed-Treasury / FRED CPI series validated in the 60/40 post; fee benchmark from ICI’s 2025 fee report.
If your own portfolio’s fee-paid-to-opportunity-cost ratio comes out well outside 2–3×, I want to know what’s different about it.