What Dividend Investing Costs You in Tax
Every calculator multiplies yield by tax rate and stops. Here is what the tax actually cost, measured against the performance effects it is competing with.
There is no shortage of tax drag calculators. They all do the same thing: multiply your dividend yield by your tax rate. A 3% yield taxed at 15% costs 0.45% a year. Correct, and almost useless on its own — because it never answers the only question that matters.
Is the tax bigger or smaller than the reason you bought dividend stocks in the first place?
I can answer that now, because the previous two posts measured those reasons. The dividend premium, once you control for value, was +0.01% a year. Dividend growth beat high yield by 0.78 points a year. Those are the prizes. Here is the bill.
First, the rates — and one thing I had wrong
| Situation | Rate on dividends |
|---|---|
| Sheltered account (401k, IRA), or taxable income under $49,450 single / $98,900 MFJ | 0% |
| Qualified dividends, most investors | 15% |
| Qualified, top bracket + net investment income tax | 23.8% |
| Non-qualified — REITs, short holding periods | up to 40.8% |
Tax year 2026, per IRS Revenue Procedure 2025-32. The 20% band starts at $545,500 single / $613,700 MFJ; the 3.8% NIIT starts at $200,000 / $250,000 and has not been indexed since 2013, so it catches more people every year.
I checked this rather than writing it from memory, and I am glad I did. The TCJA sunset did not happen. The individual provisions were scheduled to expire at the end of 2025, and a lot of writing from 2024 still assumes they did. The One Big Beautiful Bill Act, passed in July 2025, made most of them permanent.
Two mechanical points that catch people:
- “Qualified” is not automatic. You must have held the stock more than 60 days during the 121-day period beginning 60 days before the ex-dividend date. Dividend-chasing — buying just before the ex-date — fails this and converts a 15% bill into a 37% one.
- REIT distributions are mostly not qualified. That is the single biggest avoidable mistake in this area, and it is why REITs belong in a sheltered account if you have one.
Second: the drag you have heard about was calibrated on a market that no longer exists
Tax drag is proportional to yield, and yield collapsed.
| Decade | Market dividend yield | Drag at 15% | Drag at 23.8% |
|---|---|---|---|
| 1940s | 5.66% | 0.85pp | 1.35pp |
| 1950s | 4.89% | 0.73pp | 1.16pp |
| 1970s | 4.00% | 0.60pp | 0.95pp |
| 1980s | 4.20% | 0.63pp | 1.00pp |
| 1990s | 2.44% | 0.37pp | 0.58pp |
| 2000s | 1.79% | 0.27pp | 0.43pp |
| 2020s | 1.58% | 0.24pp | 0.38pp |
The latest reading is 1.33%. Against the 1940s average, that is 4.3× less tax drag at an identical tax rate, purely because companies stopped paying out as much and started buying back shares instead.
So the horror stories are real history and bad guidance. An investor deciding today faces roughly a quarter of the drag their grandparents did.
Third: what it actually cost, using real distributions
Not a formula — the actual distributions these funds actually paid, 2007–2026.
Average yield actually paid: VYM 3.03%, VIG 2.00%, SPY 1.84%.
| Tax drag, percentage points a year | VYM (high yield) | VIG (growth) | SPY (index) |
|---|---|---|---|
| 0% — sheltered or low bracket | 0.00 | 0.00 | 0.00 |
| 15% | 0.50 | 0.33 | 0.30 |
| 23.8% | 0.79 | 0.52 | 0.48 |
| 40.8% (non-qualified) | 1.34 | 0.89 | 0.83 |
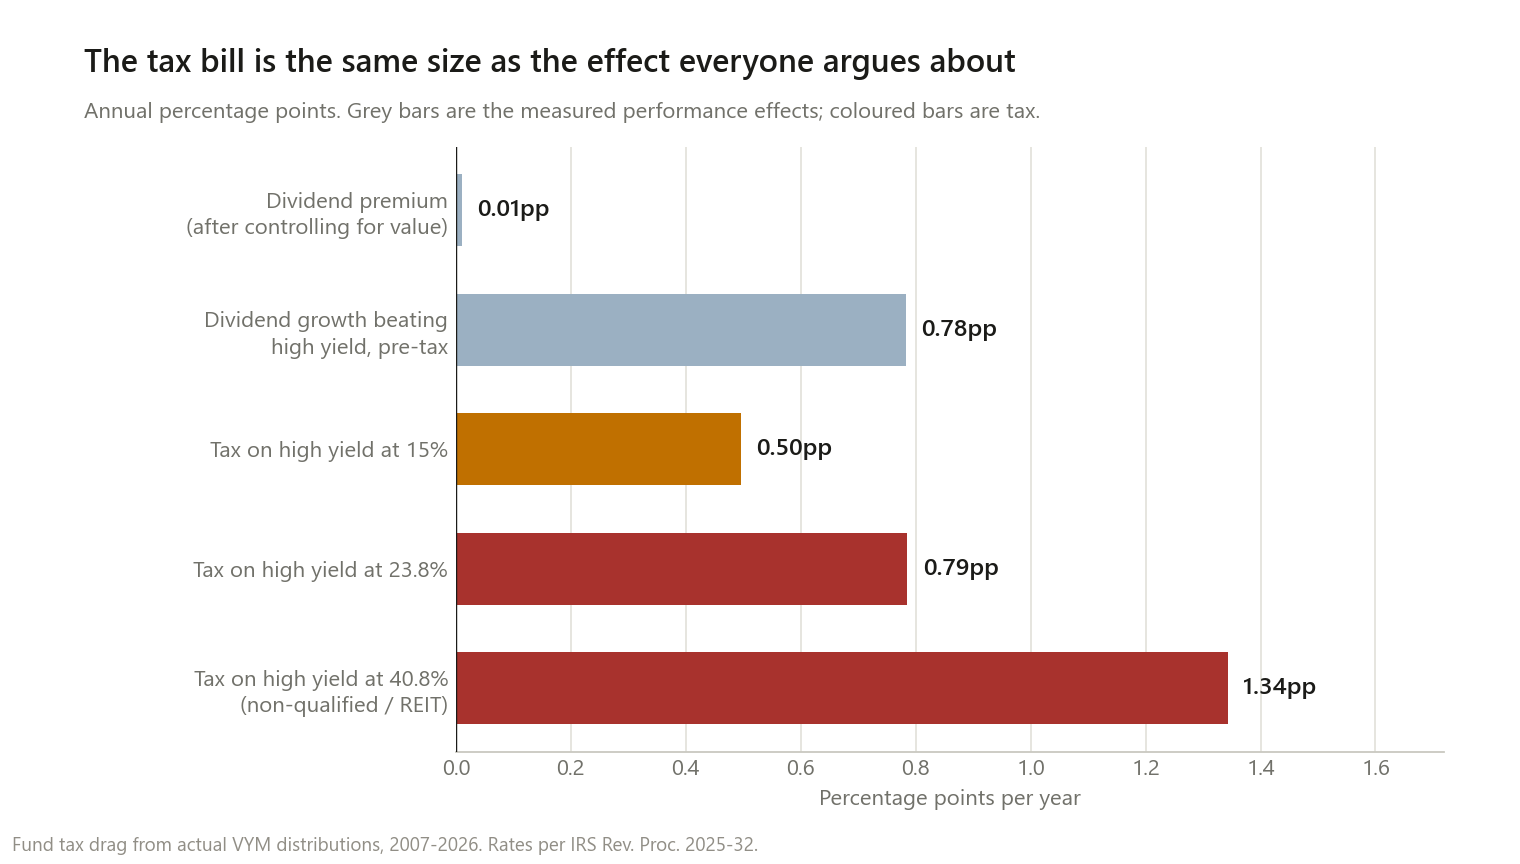
At 23.8%, the tax on VYM’s dividends costs 0.79 points a year — essentially identical to the 0.78 points that separate dividend growth from high yield, and about eighty times the dividend premium itself.
But I need to be honest about a comparison that chart invites and does not make. You would pay tax on the index’s dividends too. The right question for someone choosing between funds is the extra tax from tilting to high yield:
| Extra drag VYM pays over SPY | |
|---|---|
| At 15% | +0.19pp/yr |
| At 23.8% | +0.30pp/yr |
| At 40.8% | +0.52pp/yr |
That is a much smaller number, and it is the one to use if you are deciding between funds rather than deciding whether to invest at all. The absolute drag is large; the marginal drag of choosing high yield is 0.19 to 0.30 points. Both are true, and quoting only the first would be the same trick this site exists to catch.
Note also which way it pushes: because VYM distributes more, tax widens dividend growth’s lead. VIG beat VYM by 0.78 points pre-tax, and by 1.05 points after tax at 23.8%.
Fourth: it compounds, which is the actual argument
Every dollar paid in tax is a dollar that stops earning. $10,000 held for thirty years at each fund’s own realised return:
| VYM | VIG | SPY | |
|---|---|---|---|
| Tax-free | $149,065 | $184,613 | $228,054 |
| At 15% | $130,100 | $168,750 | $209,988 |
| At 23.8% | $120,108 | $160,080 | $200,057 |
| At 40.8% | $102,911 | $144,563 | $182,173 |
Taxation at 23.8% removed 19.4% of the high-yield investor’s terminal wealth, against 12.3% for the index investor. A 0.79-point annual drag does not sound like much. Over thirty years it is a fifth of everything.
What I would actually do with this
If you have sheltered space, this whole post is moot. Inside a 401(k) or IRA the drag is exactly zero and none of these numbers apply. The single highest-value action here is putting the income-heavy holdings — especially REITs — in the sheltered account and the low-yield holdings in the taxable one. That is free, and it is worth more than any of the performance effects in the last two posts.
If your taxable income is under $49,450 single or $98,900 married, qualified dividends are taxed at 0%. The drag is genuinely nothing. This is a real and underused situation.
If you are in the 15% band, the marginal cost of a high-yield tilt is about 0.19 points a year. That is not nothing, but it is smaller than the fee difference between many funds, and I would not reorganise a portfolio around it.
If you are at 23.8%, or holding anything non-qualified, this is the largest single number in the entire dividend discussion. It is bigger than the premium, comparable to the growth-versus-yield gap, and unlike either of those it is certain. You do not have to forecast anything for it to apply.
The pattern across all three of these posts is the same. The effects people argue about are small, uncertain, and made of something other than what the label says. The costs are larger, boring, and completely reliable. The reliable one is the one worth optimising.
Method notes and limitations
- Tax is charged when the dividend arrives, and the remainder is reinvested. Price return is left untaxed, which correctly models a buy-and-hold investor who never sells.
- This measures dividend tax only, not total tax. A full comparison would include capital gains tax at sale, which works the other way: the low-yield fund defers more gains and eventually owes more. That deferral is valuable, so this understates the case against high yield somewhat — but a complete after-all-tax model needs a holding period and a sale assumption, and I would rather compute one thing correctly.
- Every dollar of VYM’s dividends is treated as qualified in the 15% and 23.8% rows. In reality a small fraction is not, so those are mild underestimates.
- State tax is ignored entirely. It can add anywhere from 0% to over 13%.
- Fund returns are realised 2007–2026 returns, used only to project the 30-year table. That is an illustration of compounding, not a forecast.
- Rates verified for tax year 2026 against IRS Rev. Proc. 2025-32. Thresholds are indexed annually; the NIIT thresholds are not.
- US federal tax only. None of this transfers to another country’s system, and several countries tax dividends far more or far less punitively.
I am not a tax adviser, and this is research rather than personalised advice. Your own situation — bracket, account types, state, holding periods — determines which row of these tables you are in.
The code
def after_tax(parts, tau):
    """Pay tax on income as it arrives; reinvest what is left. Price untaxed."""
    return parts["price"] + parts["dy"] * (1.0 - tau)


# drag is the gap between the taxed and untaxed compounded return
for label, tau in RATES.items():
    drag = cagr(after_tax(parts["VYM"], 0.0)) - cagr(after_tax(parts["VYM"], tau))
    print(label, f"{drag*100:.2f}pp/yr")
Distributions and prices are from Yahoo Finance via yfinance; the long-run yield series
is Robert Shiller’s monthly S&P Composite data back to 1871.
If you re-run it and get something different, I want to know.