Does Buying the Dip Actually Work? 98 Years of Data
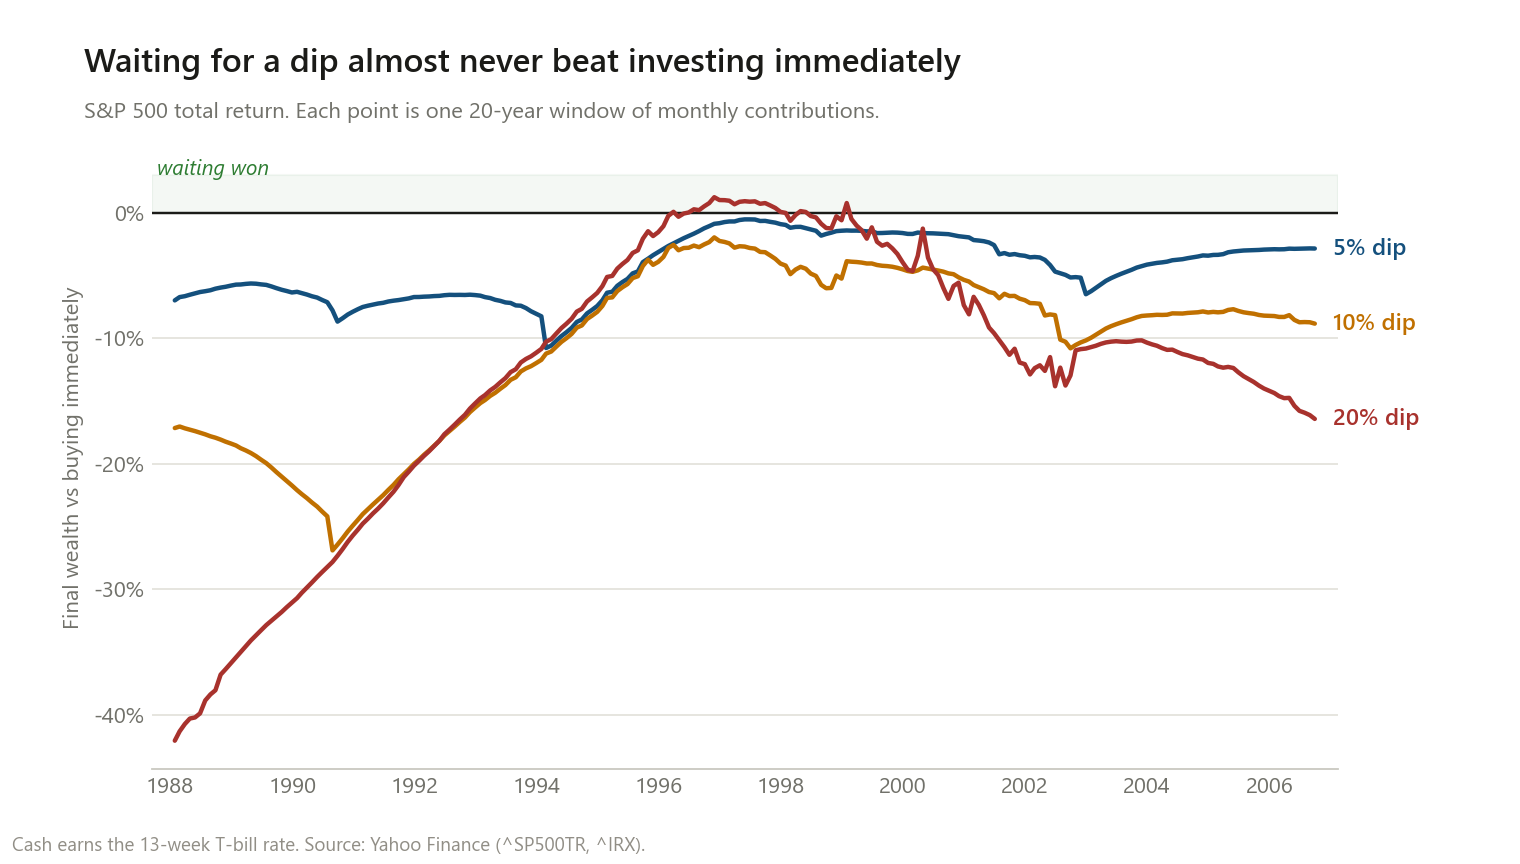
Waiting for a pullback sounds obviously smart. Across 225 rolling 20-year windows of S&P 500 data, waiting for a 5% or 10% dip won exactly zero times.
“Don’t chase it. Wait for a pullback.”
It is the most reasonable-sounding advice in investing. Stocks go up and down. If you buy on the down days instead of the up days, you pay less for the same thing. How could that possibly be worse than just buying whenever money happens to land in your account?
I tested it. The answer is worse than I expected — not because dips don’t happen, but because the waiting costs more than the discount is worth.
The rules I tested
An investor gets a fixed contribution every month — think of it as a paycheck deduction. They have to decide what to do with it.
- Buy now. Invest the contribution immediately at the month-end close. No thinking.
- Wait for a dip. Hold the contributions in cash, earning the 13-week Treasury bill rate, until the index closes at least 5% / 10% / 20% below its running all-time high. Then deploy the entire accumulated pile at once.
- Perfect foresight. Every dollar buys at the lowest price it will ever see between the month it arrives and the end of the horizon. This is not a strategy anyone can run. It is a ceiling — no timing rule can beat it, because it requires knowing the whole future.
That last one matters more than it looks, and I’ll come back to it.
The data, and which way each choice is biased
I ran two windows that are biased in opposite directions, so that a result surviving both is not an artifact of one setup.
Primary: S&P 500 total return, 1988–2026 (464 months). Dividends included. Cash earns the real 13-week T-bill rate, so waiting is not artificially punished by assuming money sits in a mattress. This is the fair test.
Long window: S&P 500 price only, 1928–2026 (1,185 months). Nearly a century, including 1929–32, 1937, 1973–74, and everything since. Two biases here, and they push against each other: price-only data understates equity returns, which is generous to sitting in cash; 0% cash penalises sitting in cash. I report it as a robustness check, not as the headline.
Result 1: waiting for a 5% or 10% dip never won
Across 225 rolling 20-year windows of S&P 500 total returns — every possible starting month from 1988 onward — here is how often waiting beat buying immediately:
| Strategy | Win rate | Median vs buy now | Worst window | Best window |
|---|---|---|---|---|
| Wait for a 5% dip | 0.0% | −4.06% | −7.40% | −0.52% |
| Wait for a 10% dip | 0.0% | −8.16% | −21.15% | −1.96% |
| Wait for a 20% dip | 10.2% | −10.96% | −31.28% | +1.24% |
Zero. Not “rarely.” In 225 overlapping 20-year windows, waiting for a 5% or a 10% pullback did not win once. The best outcome the 5% rule ever achieved was still losing by half a percent.
Over the full 1988–2026 sample, contributing $1,000 a month:
| Strategy | Final wealth | vs buy now | Months spent in cash |
|---|---|---|---|
| Buy now | $6,505,526 | — | 0% |
| Wait for a 5% dip | $6,090,299 | −6.4% | 62.7% |
| Wait for a 10% dip | $5,468,495 | −15.9% | 74.1% |
| Wait for a 20% dip | $4,058,142 | −37.6% | 85.8% |
Result 2: the cost isn’t the dip, it’s the waiting
Look at the right-hand column above. That is the whole story.
The 20% rule spends 85.8% of its months holding cash. Not because the investor is indecisive — because the market simply is not 20% below its high most of the time. The strategy is correct about the discount and wrong about the availability. You get your cheaper price, occasionally, on a pile of money that spent years earning T-bill returns while the thing you wanted to buy kept going up.
This is why the deeper dip rule performs worse, not better. A bigger discount you rarely get is a worse deal than a smaller discount you get often — and both lose to the discount you never waited for.
Result 3: the ceiling is lower than the pitch
Here is the number that reframes the whole question.
Perfect foresight — every dollar buying at the absolute lowest price it would ever see — was worth +11.6% over 38 years, compared with mechanically buying every month.
That is the ceiling. Not the expected result: the ceiling. A strategy with complete knowledge of the future, buying every contribution at its personal best possible price, beats “don’t think about it” by about eleven percent spread over four decades.
Any real dip rule captures some fraction of that upside while paying the full cash-drag cost. The 5% rule, the most patient-looking of the three, captured none of it.
Result 4: it used to work, and then it stopped
The 98-year window is where this gets genuinely interesting.
Across 946 rolling 20-year windows from 1928, waiting for a dip won 22–23% of the time — far better than the 0% in the modern sample. But the wins are not scattered. They are almost entirely at the front:
| Strategy | Win rate (1928–2026) | Last window start that won |
|---|---|---|
| Wait for a 5% dip | 22.0% | April 1977 |
| Wait for a 10% dip | 23.4% | July 1974 |
| Wait for a 20% dip | 22.5% | June 1969 |
No 20-year window beginning after April 1977 has favoured waiting for a dip. The last one that did ended in 1997.
I want to be careful about what this means. It is not proof that dip-buying is now structurally broken — the post-1977 sample is one long, historically unusual bull market, and a different next forty years could flip it back. But if your belief in buying the dip comes from market history, it is worth knowing that the supporting evidence is concentrated in the era of your grandparents’ market.
When waiting did win
The honest counter-case, because a result you can’t break is a result you haven’t tested.
In the modern sample, the 20% rule won in 23 of 225 windows — and every one of those windows started between March 1996 and January 1999. That is not a coincidence. Start accumulating cash in 1996, and you are handed the dot-com collapse and then the financial crisis inside your 20-year horizon. Two once-a-generation drawdowns arriving early enough to compound afterwards.
So the condition under which waiting wins is specific and unhelpful: a severe crash has to arrive soon after you start, and it has to be followed by a long recovery you stay invested for. You cannot know that in advance. And if you could, dip-buying would not be your best available trade.
What this does and doesn’t change
It does not mean dips aren’t real, or that buying during a crash is a mistake. If you already have cash and the market is down 30%, investing it is a fine decision. The finding is about a rule — deliberately holding new contributions out of the market waiting for a threshold that may not arrive for years.
It does not mean timing is impossible in principle. It means the ceiling on timing this particular thing is +11.6% with perfect knowledge, and the floor is −37.6% with a plausible rule. That is a bad risk-reward for the effort involved.
What it does mean: if you are holding contributions in cash right now waiting for a better entry, the historical record says the waiting is the expensive part, and it has been the expensive part in every 20-year window since 1977.
There is a structural reason for that, which I measured separately: the market’s best single days sit a median of four trading days from its worst ones, and 95% of them happen while the market is more than 10% below its high. Waiting for a dip puts you on the sidelines during precisely the stretch that pays.
Traders often try to sharpen the dip into a precise entry by buying at a Fibonacci retracement level. Across 14.7 million level touches in 499 stocks, price bounced off Fibonacci levels no more often than off the ordinary levels right next to them.
Method notes and limitations
Stating these because a result without them isn’t checkable.
- Monthly granularity. Contributions and the dip test both happen at month-end closes. A daily rule would trigger more often and would sit in cash less. I have not tested it; I would expect it to land between “buy now” and the monthly 5% rule.
- No taxes or transaction costs. These are small here and cut slightly in favour of the dip strategies, which trade less often.
- This is the “new money” question, not the lump-sum question. Whether to invest an existing pile all at once is a different problem with a different answer.
- The total-return index starts in 1988. That is 38 years, containing four major drawdowns. It is not a long sample by the standards of this question, which is exactly why I ran the 98-year price-only window alongside it.
- The dip rule is mechanical. A discretionary investor might deploy differently. The available evidence on discretionary timing is not encouraging, but this test does not address it.
- Both windows are US large-cap. I have not tested other markets, and the pre-1977 result suggests the answer is regime-dependent, so I would not assume it travels.
This is research, not personalised financial advice.
The code
Full script, both windows, in one file. The core is about thirty lines:
def buy_now(px):
    return (CONTRIB / px).sum() * px[-1]


def dip(px, cash_m, thresh):
    """Hold contributions in cash until px is thresh below its running high."""
    shares = cash = 0.0
    months_in_cash = 0
    peak = -np.inf
    for i, p in enumerate(px):
        peak = max(peak, p)
        cash = cash * (1.0 + cash_m[i]) + CONTRIB
        if p <= peak * (1.0 - thresh):
            shares += cash / p          # deploy everything
            cash = 0.0
        else:
            months_in_cash += 1
    return shares * px[-1] + cash, months_in_cash / len(px)


def best_possible(px):
    """Upper bound: each dollar buys at the lowest price from its month onward."""
    future_min = np.minimum.accumulate(px[::-1])[::-1]
    return (CONTRIB / future_min).sum() * px[-1]
Data is ^SP500TR and ^GSPC from Yahoo Finance via yfinance, resampled to month-end
closes; the cash rate is ^IRX, the 13-week Treasury bill, converted to a monthly rate.
If you re-run it and get something different, I want to know.