How Long Does the Market Actually Take to Recover?
The average is about five years. The median is two. And if you did not buy at the exact peak, the median is two days.
I went looking for the answer to this the way anyone would, and every source gave me an average. Around six months for a correction. About two years and two months for a bear market. Roughly five years for 2008.
The averages are arithmetically correct. They are also close to useless, for two separate reasons that compound each other — and one of them means the entire question is usually framed backwards.
First: the average is one episode wearing a trenchcoat
Since 1928 the S&P 500 has had twelve declines of 20% or more. All twelve eventually recovered. Here is every one of them, rather than a summary statistic:
| Peak | Depth | Months falling | Months recovering | Total underwater |
|---|---|---|---|---|
| Sep 1929 | −86.2% | 32.5 | 267.7 | 300.2 |
| Aug 1956 | −21.5% | 14.6 | 11.1 | 25.7 |
| Dec 1961 | −28.0% | 6.4 | 14.3 | 20.7 |
| Feb 1966 | −22.2% | 7.9 | 6.9 | 14.8 |
| Nov 1968 | −36.1% | 17.8 | 21.4 | 39.2 |
| Jan 1973 | −48.2% | 20.7 | 69.4 | 90.1 |
| Nov 1980 | −27.1% | 20.4 | 2.7 | 23.2 |
| Aug 1987 | −33.5% | 3.3 | 19.7 | 23.0 |
| Mar 2000 | −49.1% | 30.5 | 55.7 | 86.2 |
| Oct 2007 | −56.8% | 17.0 | 48.6 | 65.6 |
| Feb 2020 | −33.9% | 1.1 | 4.9 | 5.9 |
| Jan 2022 | −25.4% | 9.3 | 15.2 | 24.5 |
S&P 500 nominal price, dividends excluded. Months underwater is peak to new peak.
The mean is 59.9 months. The median is 25.1 months. The mean is 2.4 times the median, and it sits above ten of the twelve episodes. It is not a typical outcome; it is not near a typical outcome.
Delete a single row — 1929 — and the mean drops from 59.9 months to 38.1, a 36% move from removing one of twelve observations. Any statistic that can be moved a third of the way by one data point is not summarising a distribution. It is reporting an anecdote with extra steps.
If you want one number, use the median: about two years. If you are in the middle of a decline and want the number that actually applies to you — trough back to the old peak — the median is 17.5 months.
Second, and bigger: “peak to new peak” is the wrong question
Every version of this statistic measures from the exact top. That is the right question if and only if you bought at the exact top.
Almost nobody does. So I asked the question an actual investor has: I bought on some day. How long until I get back to even? For all 24,779 trading days since 1928, this is the number of days until the index next closed at or above the price I paid.
| Time to break even, from a random entry day | |
|---|---|
| Median | 2 days |
| 75th percentile | 6 days |
| 90th percentile | 27 days |
| 95th percentile | 79 days |
| 99th percentile | 2.6 years |
| Worst | 25.0 years |
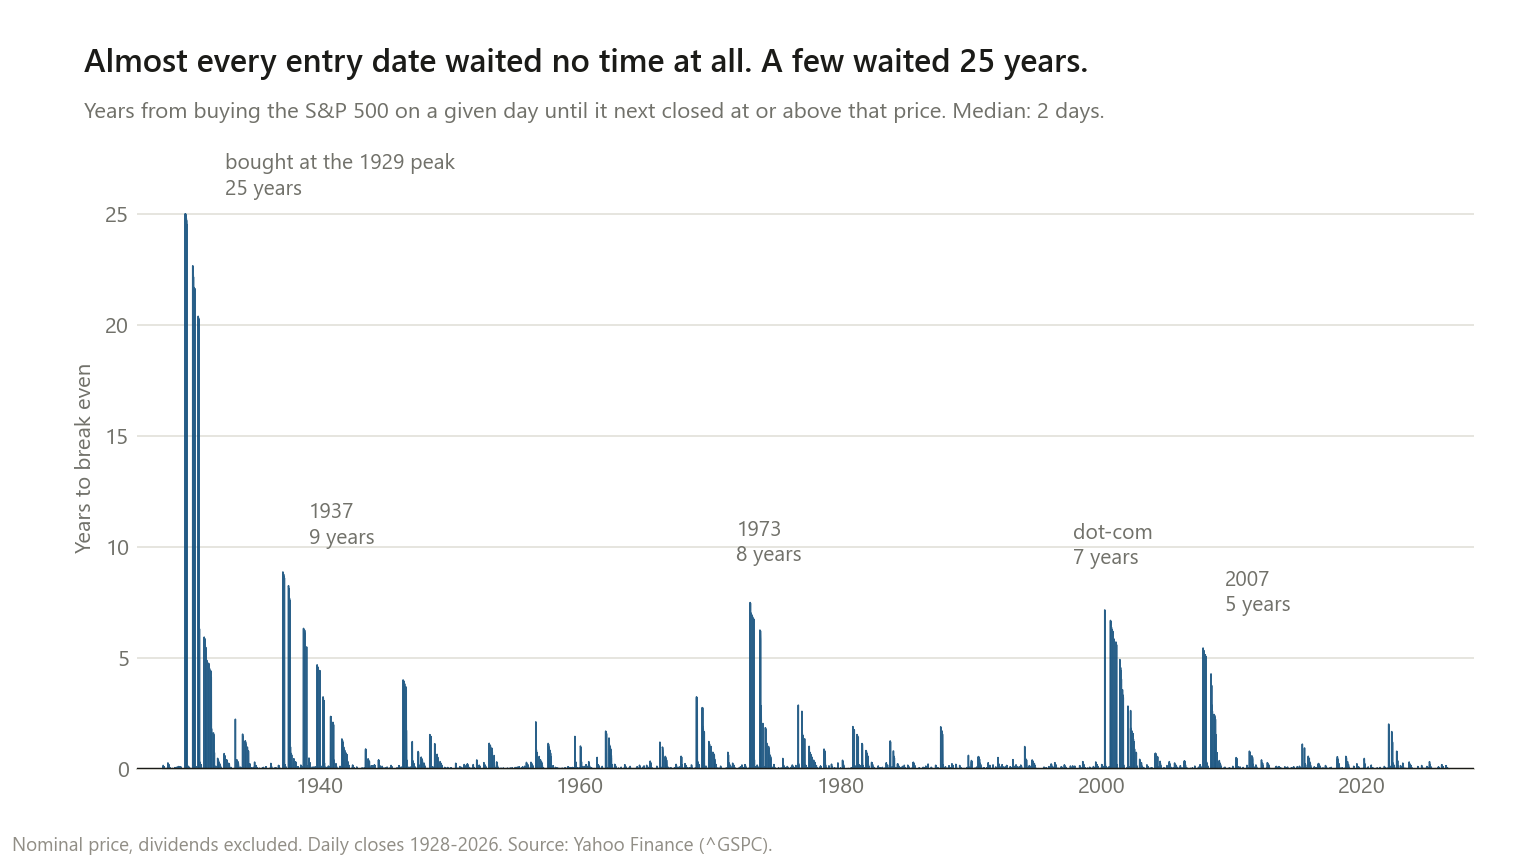
Same history, completely different picture:
- 21.5% of entry days were underwater for longer than a week.
- 9.2% for longer than a month.
- 2.0% for longer than a year.
- 0.16% for longer than ten years.
Nearly four fifths of all the days you could have bought were back above water inside a week. The catastrophic waits are real, and they are concentrated in a handful of dates that a purchase would have had to land on almost exactly.
There is a statistic that looks like it contradicts this, and it is worth separating out carefully, because I think it is the single most misread number in this topic. The index closed below its previous all-time high on 94.1% of all trading days since 1928.
That is true. It is a fact about the index, not about you. The index is measured against its own record high forever. You are measured against what you paid, once. Those are different clocks, and conflating them turns “the market is usually below its record” into “you are usually losing money”, which does not follow.
Third: the same crash has four correct answers
“How long did 1929 take?” gets published answers from about four years to twenty-five. I assumed some of them were wrong. They aren’t. They are different questions wearing the same sentence.
Three unstated choices do all the work: price or total return, nominal or inflation-adjusted, and which index. Using Shiller’s S&P Composite series back to 1871, here are all four combinations of the first two:
| Measured as | 1929 crash | Dot-com 2000 | Crisis 2007 |
|---|---|---|---|
| Nominal price | 25.0y | 6.7y | 5.4y |
| Real price | 29.2y | 14.3y | 6.1y |
| Nominal total return | 15.3y | 6.2y | 4.8y |
| Real total return | 7.2y | 12.7y | 5.4y |
For 1929 the answer ranges from 7.2 years to 29.2 years — a factor of four — with no arithmetic error anywhere. Two things drive the gap. Dividend yields in the 1930s ran far above anything modern investors have seen, so reinvested income rebuilt capital much faster than the price index suggests. And the early 1930s were deflationary, so a dollar recovered purchasing power on its own; the real total-return investor was whole in November 1936, eighteen years before the price index got back to where it started.
The dot-com column reverses the sign, which is the part I found genuinely instructive. There, adjusting for inflation makes recovery take longer — 14.3 years instead of 6.7 — because the 2000s had ordinary positive inflation eating away at a flat index. The correction is not a fixed discount you can memorise. It flips direction depending on the decade.
My own cross-check: the daily Yahoo series and Shiller’s monthly series independently put the nominal price recovery from 1929 in September 1954. Two unrelated datasets, same month.
What dividends alone are worth
Since most of the scary numbers are price-only, it is worth isolating that one choice. Same era, same crashes, total return against price:
| Peak | Price only | Total return | Saved |
|---|---|---|---|
| Mar 2000 | 86.2 mo | 73.7 mo | 12.5 mo |
| Oct 2007 | 65.6 mo | 53.8 mo | 11.8 mo |
| Feb 2020 | 5.9 mo | 5.7 mo | 0.2 mo |
| Jan 2022 | 24.5 mo | 23.3 mo | 1.2 mo |
Roughly a year off each of the two long ones. The share of days spent below the previous high drops from 94.1% to 89.2%, and days more than 20% below drop from 36.5% to 14.5%. Worst case for an entry day falls from 25.0 years to 6.1.
Notably, in the total-return window the mean and median underwater periods are 39.1 and 38.5 months — essentially identical. The skew that makes the price-only average misleading is largely a 1929 artefact, and I should say so rather than pretend the average is always useless.
What I would actually take from this
If you are asking because you are underwater right now: the relevant median is 17.5 months from the bottom, the typical decline of this class was −33.7%, and all twelve recovered. That is not a promise. It is the base rate.
If you are asking because you are afraid to buy: the honest number is not five years, it is two days. The 25-year outcome required buying within days of the single worst peak in the history of the index, holding only price returns, and ignoring deflation.
If you are asking whether to wait for a better entry: that has its own answer, and it is no — waiting for a dip lost in every one of 225 rolling 20-year windows. Related, the best single days cluster inside exactly these recovery periods, which is why being absent during them is expensive.
The thing worth internalising is not a duration. It is that the answer’s spread is wider than its centre, so any single number — mine included — is hiding more than it shows.
Method notes and limitations
- Calendar days, not trading days, for break-even times, since waiting is experienced in calendar time. Episode durations are in months of 30.44 days.
- Break even means the index closed at or above your purchase price, before tax, costs, and inflation. It is a floor on recovery, not a measure of feeling recovered.
- Right-censoring is negligible but real. Six of 24,779 entry days had not recovered by 25 August 2026. They are the handful of very recent days sitting at record highs, which is the expected and uninteresting kind of censoring. Excluding them cannot bias the tail.
- The 20% threshold is a convention, not a natural boundary. A 19.8% decline is not meaningfully different from a 20.2% one, and moving the threshold changes the episode count.
- The Shiller series is monthly, so those recovery dates are month-resolution and can differ from daily-data answers by a few weeks. That is why the four-way table is monthly throughout rather than mixing resolutions.
- Shiller’s dividend figure is annualised, so I accrue one twelfth per month. This is the standard construction and it is an approximation.
- Yahoo’s data is unaudited, and I have found bad prints in its pre-war series before. Episode boundaries depend on extremes, so this matters here; the 1954 agreement with Shiller is partly a check on that.
- US large-cap only. Markets that did not recover — or took generations — exist, and a survivorship-heavy sample of one country is exactly the wrong data for estimating that risk.
This is research, not personalised financial advice.
The code
def next_at_or_above(a):
    """For each i, the first j > i with a[j] >= a[i]. -1 if it never happens.

    Monotonic stack, O(n). The day you get your money back is simply the next
    day the index closes at or above where you bought.
    """
    n = len(a)
    res = np.full(n, -1, dtype=np.int64)
    stack = []
    for i in range(n):
        while stack and a[stack[-1]] <= a[i]:
            res[stack.pop()] = i
        stack.append(i)
    return res


# the four defensible answers to "how long did it take?"
nominal_price = df["P"]
real_price    = df["P"] / df["CPI"]
nominal_tr    = ((df["P"] + df["D"] / 12) / df["P"].shift(1)).fillna(1).cumprod()
real_tr       = nominal_tr / df["CPI"]
Data is ^GSPC and ^SP500TR daily closes from Yahoo Finance via yfinance, plus Robert
Shiller’s monthly S&P Composite series (price, dividends, CPI) back to 1871.
If you re-run it and get something different, I want to know.