What Perfect Market Timing Is Actually Worth
Buying at every yearly low instead of every yearly high was worth about 27 percentage points. Here is every window since 1928, not the one usually quoted.
You have probably met Bob, the world’s worst market timer. He invests only at market peaks, right before every crash, and ends up rich anyway because he never sells. Charles Schwab has a version of the same character called Rosie Rotten. The lesson is always the same: time in the market beats timing the market.
It is a good story. My problem with it is that it is a story — one investor, one path, one stretch of history. Schwab’s widely quoted figure, that perfect timing beat worst timing by 18.7%, comes from a single 20-year window.
A single window is a description of that window, not a result. So I ran all of them.
The setup
Four investors. Each contributes $2,000 once a year, every year, and never sells.
- Perfect. Buys at the year’s lowest close. Requires hindsight nobody has.
- Immediate. Buys on the first trading day of the year. Requires nothing at all.
- Worst. Buys at the year’s highest close. Maximum bad luck, every single year.
- Cash. Never invests. Holds Treasury bills.
The gap between Perfect and Worst is worth naming, because it is the thing everyone is actually arguing about:
Perfect minus Worst is the entire prize pool for market timing. No timing rule can do better than buying every low. None can do worse than buying every high. Every market timer who ever lived was competing for the space between those two lines — and nothing else.
Same two windows as the buy-the-dip test, biased in opposite directions: S&P 500 total return 1988–2025 with real T-bill rates for cash, and price-only data back to 1928 as a robustness check.
Result 1: the prize pool is about 27 points
| Holding period | Perfect vs immediate | Worst vs immediate | Prize pool | Windows |
|---|---|---|---|---|
| 10 years | +10.66% | −14.08% | 30.16pp | 29 |
| 20 years | +14.47% | −13.35% | 31.61pp | 19 |
| 30 years | +9.73% | −14.71% | 27.97pp | 9 |
Medians, S&P 500 total return, 1988–2025.
The 98-year price-only window lands in nearly the same place — +10.15% / −13.18% at ten years, +10.49% / −12.98% at thirty. Two samples, one of them three times longer than the other, biased in opposite directions, and they agree to within about a point. I do not often get results this stable.
So the honest answer to “what is perfect timing worth?” is: roughly +10% to +14% against just buying on day one. Not doubling your money. Not even close.
Result 2: holding longer did not undo bad timing
This is the part I got wrong before running it.
I expected the penalty for bad timing to shrink with time — that is the whole moral of the Bob story. It doesn’t.
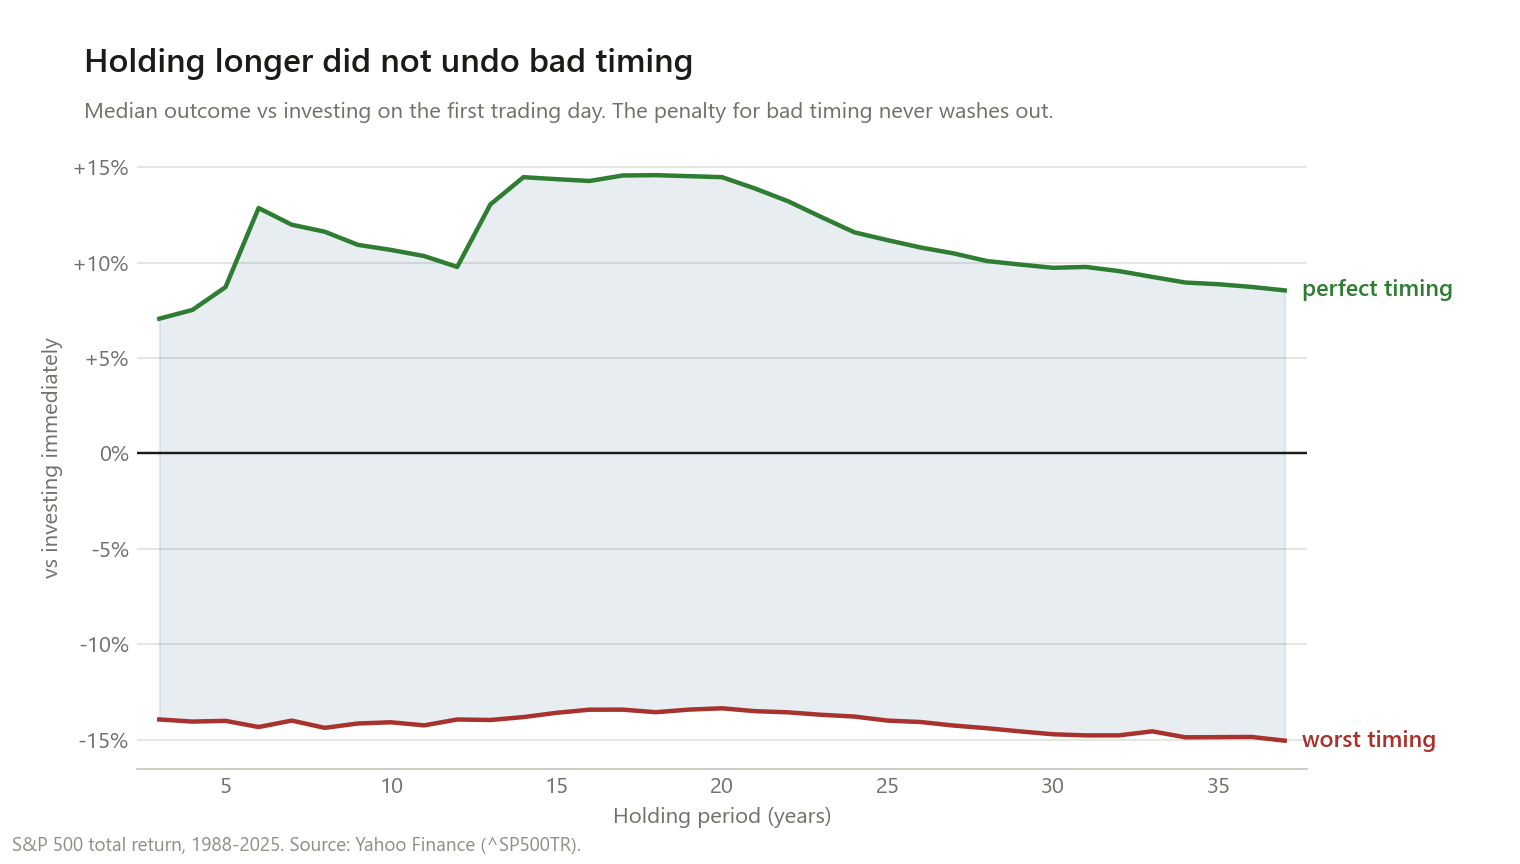
| Holding period | Perfect | Worst | Spread |
|---|---|---|---|
| 3 years | +7.06% | −13.94% | 20.99pp |
| 5 years | +8.71% | −14.01% | 22.72pp |
| 10 years | +10.66% | −14.08% | 24.74pp |
| 20 years | +14.47% | −13.35% | 27.83pp |
| 30 years | +9.73% | −14.71% | 24.44pp |
| 35 years | +8.86% | −14.86% | 23.73pp |
The reason is not mysterious once you see it. Every contribution overpays by roughly the same proportion — the average distance from a year’s high to its opening price doesn’t change just because you hold the shares longer. You bought fewer shares. More years of compounding grows both portfolios at the same rate, so the percentage gap survives intact.
Compounding multiplies a gap. It does not close one.
Result 3: but bad timing still crushed not investing
Here is where the Bob story is right, and where the confusion comes from.
| Holding period | Worst timing beat cash | Median multiple vs cash |
|---|---|---|
| 10 years | 86.2% of windows | 1.50× |
| 20 years | 100% of windows | 1.88× |
| 30 years | 100% of windows | 3.86× |
The world’s worst market timer finished with nearly four times what he would have had sitting in Treasury bills for thirty years. Every single 20-year and 30-year window. No exceptions.
So both things are true at once, and they are not the same claim:
- Against doing nothing, time in the market fixes bad timing completely.
- Against simply buying on day one, time in the market fixes nothing at all. The −14% is permanent.
“Time in the market beats timing the market” quietly compares the bad timer to someone who stayed in cash. That is a real and important comparison — most people’s actual alternative to investing badly is not investing at all. But it is not the comparison the phrase sounds like it is making, and the difference is 14% of a lifetime’s savings.
Result 4: timing was worth most exactly when it was hardest
The perfect-timing line in that chart wobbles between about +7% and +15%. That wobble is not noise, and it points at something worth knowing.
| 10-year window | Perfect-timing premium |
|---|---|
| 2000–2009 | +23.58% |
| 2001–2010 | +23.14% |
| 2002–2011 | +21.54% |
| … | … |
| 1989–1998 | +4.73% |
| 1992–2001 | +4.61% |
| 1991–2000 | +3.58% |
The decade where buying every low would have paid best is the decade with the dot-com crash and the financial crisis in it. The decade where it paid worst is the smooth 1990s bull market. A spread of nearly seven to one.
The mechanism is simple: timing skill only pays when a year’s high and its low are far apart. In a year that grinds steadily upward, there is barely any gap to capture. In 2008 there was an enormous one.
Which produces an uncomfortable symmetry. The periods that would have rewarded good timing most are precisely the periods when buying feels impossible — you are being asked to deploy cash into a market that has just fallen 40% and shows no sign of stopping. The reward for timing is concentrated in exactly the moments when almost nobody executes it.
That pattern shows up again at the level of single days: the market’s twenty best days cluster inside its worst drawdowns, a median of four trading days from one of its twenty worst.
What this means for an actual decision
If you are sitting on money you intend to invest and you are hesitating because the market looks high, this is the relevant arithmetic:
Your downside is bounded. The worst possible outcome — buying at the exact high, every year, for decades — costs about 14% against buying immediately, and still beats cash by a wide margin over any horizon longer than about ten years.
Your upside is bounded too, and it is smaller than the effort suggests. Perfect foresight is worth around 10–14%. Any real timing rule captures a fraction of that, and waiting for dips specifically captured none of it — zero wins in 225 rolling 20-year windows.
A prize pool of 27 points, split so that the achievable half is 10–14 and requires knowing the future, is not a game worth entering. It is, however, a very good reason to stop worrying about whether today is a good day.
Method notes and limitations
- Annual contributions, not monthly. I used one purchase per year to match the convention in the Bob/Rosie literature so the numbers are comparable. Monthly contributions would compress every gap here, because more purchases means more averaging — bad timing would look even less consequential.
- “Worst” is worse than any real person achieves. Hitting the exact yearly high every year for thirty consecutive years has a probability indistinguishable from zero. Treat it as a floor, not a forecast.
- Perfect and Worst both require hindsight, so neither is available. Only Immediate and Cash are strategies you can actually run.
- The current year is excluded from every window, since its high and low are not settled yet.
- No taxes or costs. All four investors are treated identically, so this mostly cancels, but a real taxable account would differ.
- US large-cap only, and the modern window is 38 years. The 98-year window agrees, which is reassuring, but both are the same market. I would not assume this travels to markets with different histories.
- Cash is Treasury bills, not a mattress. Setting cash to 0% would flatter the bad timer considerably, and several versions of this comparison do exactly that.
This is research, not personalised financial advice.
The code
def year_table(px):
    """Per calendar year: first close, lowest close, highest close, last close."""
    g = px.groupby(px.index.year)
    return pd.DataFrame({
        "first": g.first(), "low": g.min(), "high": g.max(), "last": g.last(),
    })


def terminal(tab, years, col, final_px):
    """Contribute a fixed amount each year at `col`; hold everything to final_px."""
    return (CONTRIB / tab.loc[years, col]).sum() * final_px


# perfect = buy every low, worst = buy every high, immediate = buy day one
per = terminal(tab, window, "low",   final_price)
imm = terminal(tab, window, "first", final_price)
wor = terminal(tab, window, "high",  final_price)
Data is ^SP500TR and ^GSPC daily closes from Yahoo Finance via yfinance; the cash
rate is ^IRX, the 13-week Treasury bill, averaged to an annual rate.
If you re-run it and get something different, I want to know.