Is the 60/40 Portfolio Dead?
It has been declared dead eleven times since 1926. Here is what happened in the three years after each one, and what actually drives the stock-bond correlation.
The 60/40 obituary is a genre. It ran after 2008, after 2018, loudly after 2022, and BlackRock published another one this year. The argument is always the same: stocks and bonds fell together, so bonds have stopped hedging, so the whole design is broken.
Rather than argue, I counted. Since 1926 there have been ten calendar years where a 60/40 portfolio lost 10% or more in real terms — ten occasions that would have produced this headline. Here is what happened after each one, and then the actual mechanism, which turns out to be more interesting than the obituary.
First, was 2022 really that bad?
Yes. It was not overblown.
| Year | Nominal | Real |
|---|---|---|
| 1931 | −27.0% | −19.5% |
| 1937 | −20.9% | −23.1% |
| 2022 | −18.2% | −23.1% |
| 2008 | −17.2% | −17.2% |
| 1930 | −16.6% | −10.9% |
| 1974 | −15.9% | −25.1% |
| 1973 | −10.6% | −17.8% |
In real terms 2022 ties 1937 as the second-worst year for 60/40 in a century, beaten only by 1974. Inflation is what did it — the nominal loss was a point smaller than 1931’s, but 2022’s inflation turned it into something close to the worst on record.
So the premise of the 2022 obituaries was sound. The question is what follows.
What happened after the previous nine
Forward real annualised returns after every year 60/40 lost 10%+ in real terms:
| Year | That year | Next 1y | Next 3y | Next 5y |
|---|---|---|---|---|
| 1930 | −10.9% | −19.5% | +7.2% | +9.5% |
| 1931 | −19.5% | +12.3% | +16.5% | +18.2% |
| 1937 | −23.1% | +23.7% | +7.7% | +1.5% |
| 1941 | −15.3% | +1.6% | +8.9% | +5.2% |
| 1946 | −17.7% | −5.9% | +2.7% | +5.1% |
| 1969 | −13.9% | +1.6% | +6.4% | −5.8% |
| 1973 | −17.8% | −25.1% | +0.6% | −2.1% |
| 1974 | −25.1% | +16.5% | +7.8% | +4.0% |
| 2008 | −17.2% | +9.2% | +8.6% | +9.8% |
| 2022 | −23.1% | +13.3% | +10.9% | — |
The three-year column has no negative entries. Ten out of ten times, the three years following a double-digit real loss were positive in real terms — median +7.77% a year.
The one-year column is much noisier: positive in only 7 of 10, and 1973 was followed by an even worse 1974, so the median next-year return is a modest +5.41%. Five years out, positive in 7 of 9. The recovery is reliable at three years and distinctly unreliable at one.
2022 has already delivered +13.3% real the following year and +10.9% a year over the following three. The obituaries were written into a recovery that was, by this record, the base case.
I want to be careful about what that does and does not prove. Ten observations is not many, the forward windows overlap, and “it recovered every time before” is exactly the reasoning that fails the one time it matters. What the table rules out is the strong claim — that a bad year signals a broken design. It has never been that signal yet.
The real argument: bonds stopped hedging
The serious version of the case is not about one bad year. It is that the stock-bond correlation went positive, which removes the reason to hold the 40 at all.
That is a genuine, testable claim. It is also not a constant.
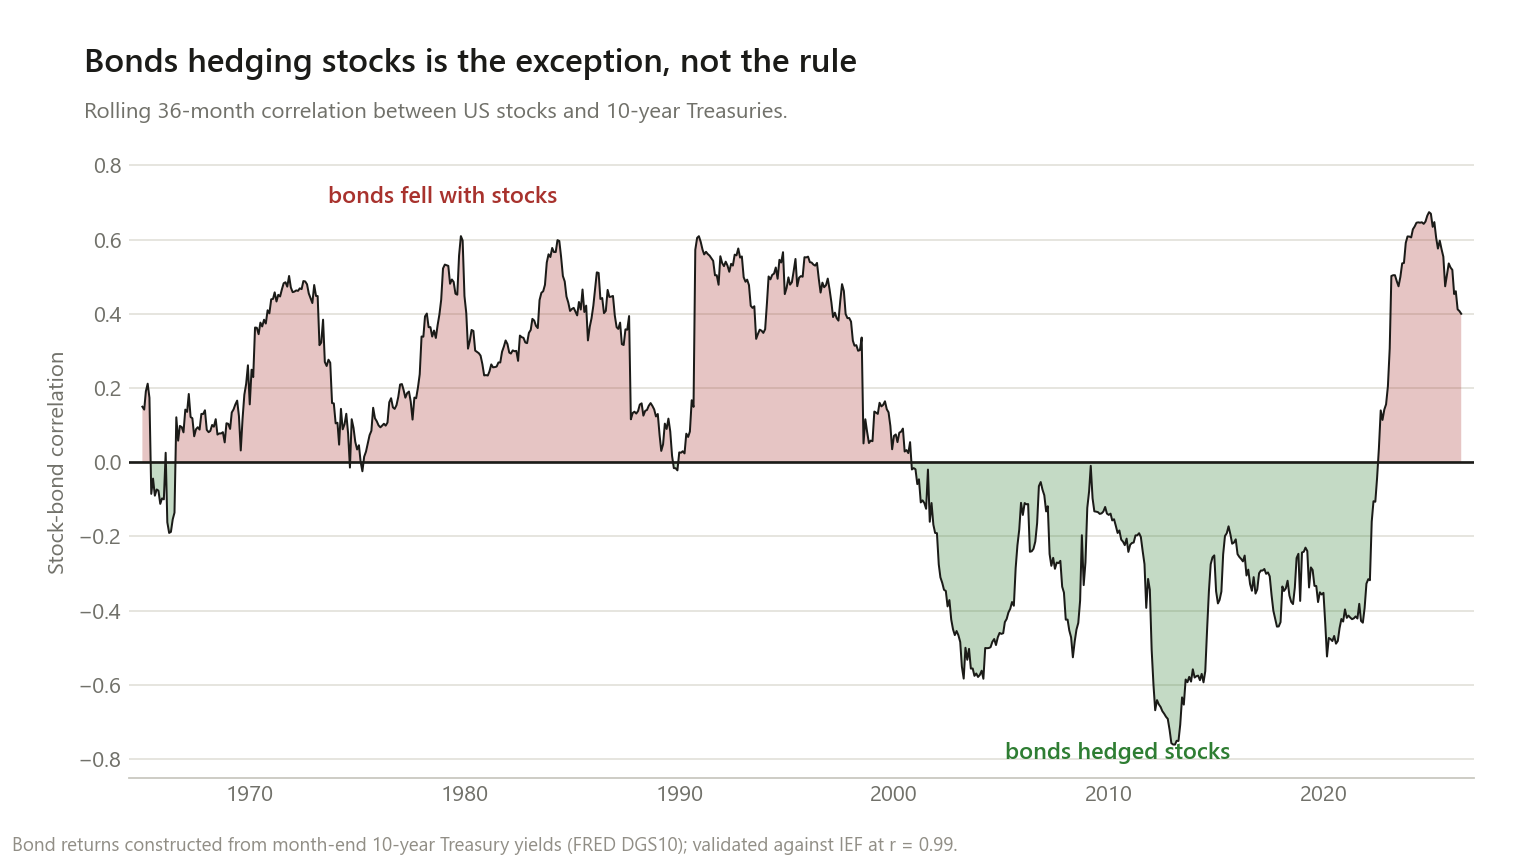
| Era | Mean correlation | Months negative |
|---|---|---|
| 1960s | +0.07 | 22% |
| 1970s–80s | +0.31 | 2% |
| 1990s | +0.40 | 0% |
| 2000–2019 | −0.32 | 96% |
| 2020–2026 | +0.15 | 40% |
This is the finding that reframes the whole debate. The negative stock-bond correlation that everyone treats as the natural order of things existed for about twenty years. Across 1962–2026 the correlation is negative in only 37.9% of months, and almost all of those months are in one stretch.
So “bonds no longer hedge stocks” is true, and it is not new, and it is not a malfunction. It is the normal state, and 2000–2021 was the anomaly. Anyone whose investing life began after 2000 learned the exception as the rule.
What actually flips it: inflation
Splitting every month by the prevailing inflation rate:
| CPI year-on-year | Months | Mean stock-bond correlation |
|---|---|---|
| Under 2% | 160 | −0.22 |
| 2–3% | 179 | +0.08 |
| 3–5% | 224 | +0.20 |
| Above 5% | 174 | +0.20 |
Monotonic, and the correlation between the inflation level and the stock-bond correlation is +0.309.
The mechanism is not mysterious. When the dominant shock is growth — a recession scare — stocks fall and the central bank cuts, so bonds rise. Bonds hedge. When the dominant shock is inflation, the discount rate rises and both sides reprice downward together. Bonds cannot hedge a shock that hits them directly.
Low inflation is what buys you a negative correlation. That is why 2000–2021 worked and why 2022 did not, and it means the useful question is not “is 60/40 dead” but “what kind of shock do I expect next?”
So how often has 60/40 actually failed?
Over 1,080 rolling ten-year windows:
| Median 10-year real return | +5.46%/yr |
| Worst | −3.42%/yr (window ending June 1982) |
| Best | +12.70%/yr |
| Windows negative in real terms | 9.9% |
| Windows ending 2020–2026 | +5.63% median |
One decade in ten lost money in real terms. That is the honest failure rate, and it is not zero — the stagflation windows ending around 1982 were genuinely bad, and they were bad for exactly the reason above.
Over the long run the arithmetic is unremarkable: stocks 7.15% real, 10-year Treasuries 1.56% real, 60/40 5.34% real at 11.45% volatility against stocks’ 18.35%. You give up roughly 1.8 points of real return for a third less volatility.
What I would take from this
“Dead” is the wrong frame. 60/40 is not a strategy that works or breaks; it is a trade of return for volatility whose diversification component depends on the inflation regime. In low inflation you get the volatility reduction almost free. In high inflation you pay for it.
The 40 still does something even when correlation is positive. Bonds were about a third as volatile as stocks over this sample. Lower volatility on its own reduces portfolio risk regardless of the correlation sign — the hedge is a bonus, not the whole job.
If your concern is specifically inflation, bonds are the wrong tool and always were. That is an argument for adding something else — TIPS, or the usual suggestion of gold — not for abandoning the structure. Gold’s actual record as a portfolio diversifier is the next thing I want to test properly.
And adding assets is a different lever from adding holdings. Diversifying within US equities saturates at about nine independent bets no matter how many names you own; changing the kind of exposure is the only thing that moves that number.
Beware of intuitions formed in 2000–2021. If you learned that bonds rally when stocks fall, you learned the twenty-year exception.
Method notes and limitations
- The bond series is constructed, not an index. I price a 10-year par Treasury each month and reprice it a month later at the new yield. Validated against IEF over 286 overlapping months: correlation 0.990, volatility 7.52% against IEF’s 6.65%. The volatility gap is expected — IEF holds 7–10 year bonds, so it is shorter duration than a constant 10-year.
- Month-end yields, and this mattered a lot. FRED’s
GS10is a monthly average of daily yields, and differencing an average introduces a timing error that pulls month-to-month correlations toward zero — precisely the quantity this post measures. Using month-endDGS10instead lifted the validation correlation from 0.718 to 0.990. My first run used the average and understated every correlation in the era table. - The correlation analysis starts in 1962, where daily yields begin. Pre-1962 figures rest on monthly averages and are attenuated, so I show them marked rather than mixing them into the headline.
- Ten bad years is a small sample, the forward windows overlap, and the recoveries are not independent draws. Treat the “10 of 10” as a description of the record, not a probability.
- No taxes, costs, or rebalancing frictions. 60/40 here is rebalanced monthly, which flatters it slightly against a drifting portfolio.
- US Treasuries and US stocks only. Corporate bonds, TIPS, and international bonds all behave differently, and TIPS in particular are the direct answer to the inflation problem identified above.
- Nominal 10-year Treasuries are one choice of “the 40”. Shorter duration would have lost far less in 2022 and hedged less in 2008.
This is research, not personalised financial advice.
The code
def bond_month_return(y_prev, y_now, n=10.0, dt=1.0 / 12.0):
    """One month of a constant-maturity par bond, repriced at the new yield.

    Buy a 10-year par bond yielding y_prev (coupon y_prev, price 100). A month
    later it has n - dt years left and is priced at y_now. If yields do not
    move this returns (1+y)^(1/12) -- the bond earns its yield, which is the
    check that the construction is right.
    """
    t = np.arange(1, int(n) + 1) - dt
    pv_coupons = (y_prev * 100.0 / (1.0 + y_now) ** t).sum()
    pv_principal = 100.0 / (1.0 + y_now) ** t[-1]
    return (pv_coupons + pv_principal) / 100.0 - 1.0


# the regime, not the average
roll = stocks.rolling(36).corr(bonds)
Stock returns are the Ken French market series; yields are FRED DGS10 (month-end) with
Shiller’s series before 1962; inflation is FRED CPIAUCNS.
If you re-run it and get something different, I want to know.