Does Gold Actually Help a Portfolio?
Yes, but not for the reason it is sold, and the optimal allocation everyone quotes was the right answer in zero of the last six decades.
The previous post ended somewhere uncomfortable: bonds cannot hedge an inflation shock, because inflation hits bonds directly. The asset usually proposed to fill that gap is gold.
Before testing it, a note on sourcing. Searching this question returns the World Gold Council — the mining industry’s marketing body — plus bullion dealers and gold IRA providers. They are not lying, but they are selling. So every price here comes from the World Bank’s commodity data, and the answer comes out more complicated than either side of that argument.
Sample starts September 1971. Before that the dollar was pegged to gold at $35, so gold’s “returns” were an administrative decision rather than a price.
Gold on its own is not a good asset
| 1971–2025 | Nominal | Real | Volatility | Sharpe | Worst drawdown |
|---|---|---|---|---|---|
| Gold | 8.67% | 4.60% | 17.10% | 0.32 | −62.1% |
| Stocks | 11.15% | 6.98% | 15.74% | 0.48 | −50.3% |
| 10y Treasuries | 6.07% | 2.10% | 7.97% | 0.24 | −26.0% |
| 60/40 | 9.48% | 5.38% | 10.18% | 0.52 | −30.3% |
Gold was more volatile than stocks, had a worse drawdown than stocks, and returned less. On every standalone measure it is a worse version of equity. If someone tells you gold is a store of value, note that it lost 62% of its nominal value at one point and spent the 1980s and 1990s losing money in real terms.
But standalone is the wrong test, and the decade table shows why:
| Decade | Gold, real | Stocks, real | Average CPI |
|---|---|---|---|
| 1970s | +23.14% | −1.83% | 7.43% |
| 1980s | −5.85% | +11.20% | 5.56% |
| 1990s | −6.36% | +14.63% | 3.00% |
| 2000s | +12.07% | −2.83% | 2.57% |
| 2010s | +0.92% | +11.64% | 1.77% |
| 2020s | +13.25% | +10.19% | 3.97% |
Look at the first two columns. Gold’s two great decades are the two decades stocks lost money. Its two worst are the two best decades for stocks. That is not a return story, it is a diversification story, and it is the entire case for holding any.
It is not an inflation hedge
This is where the conventional pitch falls apart, and it surprised me.
| CPI year-on-year | Months | Gold, real | Bonds, real |
|---|---|---|---|
| Under 2% | 147 | +4.90% | +4.17% |
| 2–3% | 162 | +4.09% | +0.98% |
| 3–5% | 192 | +6.46% | +6.15% |
| Above 5% | 150 | +2.52% | −3.61% |
Gold’s weakest real return came in the highest-inflation regime. Its best came at 3–5% inflation, and it did perfectly well below 2%. The correlation between monthly inflation and monthly gold returns is +0.154 — positive, but nowhere near strong enough to support “gold protects you from inflation” as a mechanism.
What is true is the comparison in the last row: in high inflation gold returned +2.52% real while bonds lost 3.61%. Gold beat bonds by six points a year in exactly the regime that breaks bonds. But that is gold being unharmed, not gold being a hedge. The distinction matters, because an asset that merely fails to fall is worth much less than one that rises to offset your losses.
The correlations say the same thing:
| Correlation | |
|---|---|
| Gold vs stocks | −0.036 |
| Gold vs bonds | −0.008 |
Not negative. Zero. Gold is not a hedge against anything — it is an asset that is simply unrelated to the rest of your portfolio. That turns out to be enough.
Adding it to 60/40 does work
| Gold weight | Return | Volatility | Sharpe | Worst drawdown |
|---|---|---|---|---|
| 0% | 9.48% | 10.18% | 0.52 | −30.3% |
| 5% | 9.54% | 9.68% | 0.55 | −26.6% |
| 10% | 9.59% | 9.26% | 0.57 | −24.3% |
| 20% | 9.66% | 8.72% | 0.61 | −20.9% |
Return goes slightly up, volatility goes meaningfully down, and the worst drawdown improves by nine points at a 20% weight. This is the free-lunch shape that genuine diversification produces, and it is why the gold industry’s charts look persuasive. The full-sample Sharpe-maximising weight is 27%.
Which brings us to the number everyone quotes, and the reason I do not believe it.
The optimal allocation is not stable
A full-sample optimum is the most overfittable statistic in finance: you are asking what weight would have been best using data you already have. The test that matters is whether that answer holds up out of sample. So here it is, decade by decade:
| Decade | Sharpe-maximising gold weight |
|---|---|
| 1970s | 50% |
| 1980s | 0% |
| 1990s | 0% |
| 2000s | 50% |
| 2010s | 10% |
| 2020s | 50% |
Zero to fifty percent. And the full-sample answer of 27% was the right answer in none of the six decades — it is an average of two extremes that never occurred.
Anyone telling you the optimal gold allocation is 15%, or 18%, or 25% has fitted a number to history and presented it as a parameter. The honest version is that the correct weight depends entirely on which decade you are about to live through, and nobody knows that in advance.
What it actually feels like to hold
There is a tension between two results above. Over the full sample, 10% gold produced a higher return than plain 60/40. But run every rolling ten-year window:
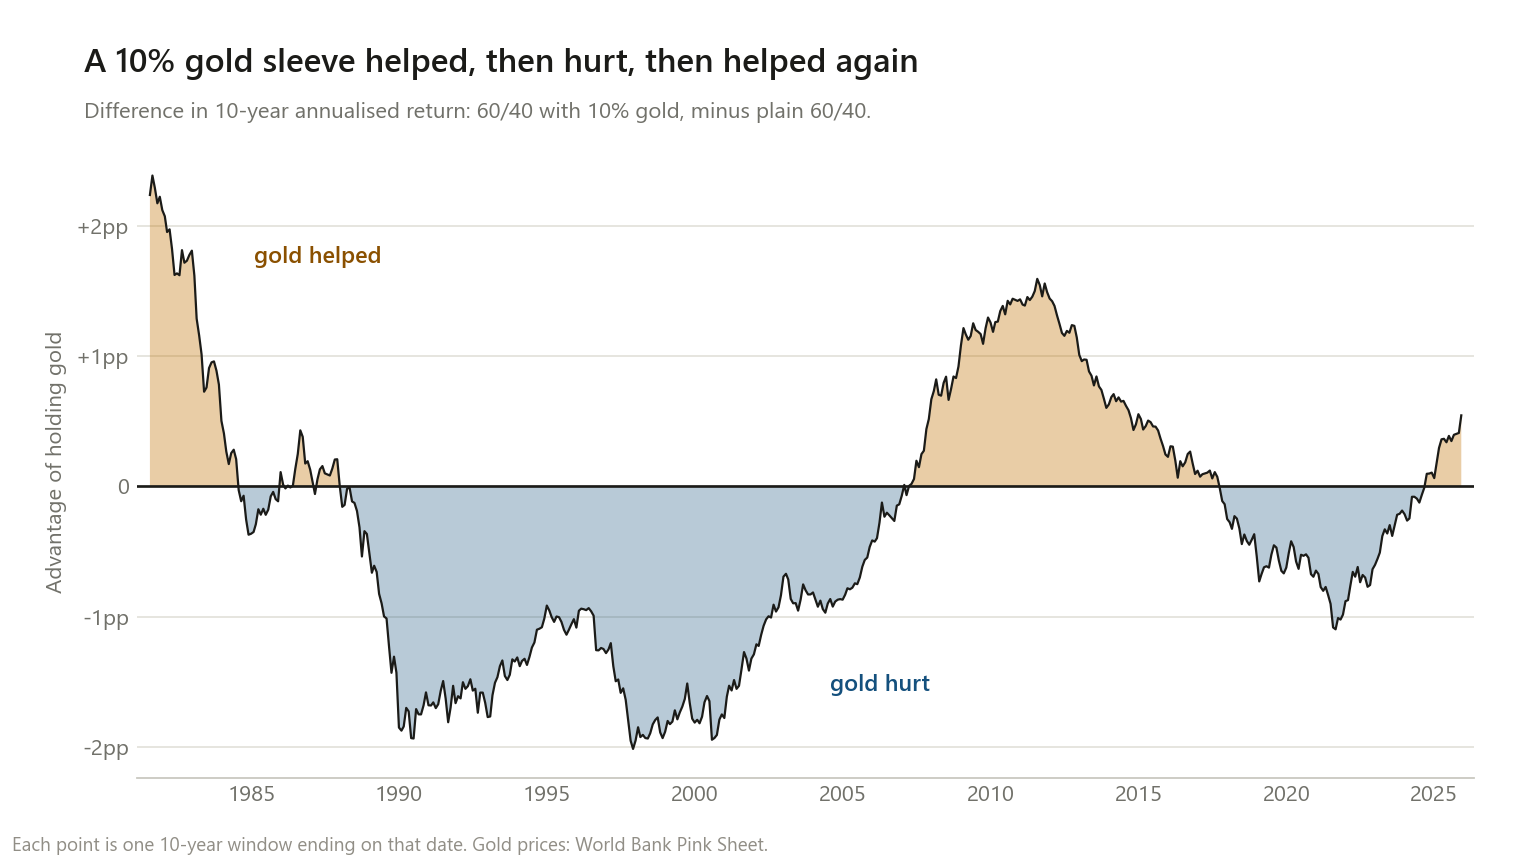
Across 532 rolling ten-year windows, a 10% gold sleeve beat plain 60/40 in only 37.4% of them, with a median of −0.37 percentage points a year.
Both things are true. Gold’s contribution is right-skewed: in most decades you pay a small drag, and occasionally you get paid enormously. The mean is positive because of the 1970s and the 2000s; the median is negative because of everything else.
That is the profile of insurance, not of an investment. And it means the experience of holding gold is mostly the experience of regretting it — which is precisely why so few people hold it through to the payoff.
For what it is worth, the recent record is unflattering: of windows ending 2020–2026, only 19.7% favoured gold.
What I would take from this
The diversification benefit is real and the return story is not. Every reliable thing gold did in this data came from being uncorrelated, not from going up. If you want the volatility and drawdown reduction, that is genuinely available.
Do not anchor on an optimal weight. Anything from 5% to 10% captures most of the Sharpe improvement in the table above without requiring you to believe a number that has never been right for a decade at a time. Sizing this by conviction in a forecast is the mistake.
Do not buy it as an inflation hedge. It was weakest in the highest inflation regime. If inflation is the specific risk you want to neutralise, TIPS do the job directly and gold does it by accident.
Expect to regret it about six years in ten. If a −0.37pp median drag over a decade would make you sell, you will sell before the part that justifies it, and you would have been better off never starting.
The pattern here is the same one that keeps recurring on this site: the effect is real, much smaller than advertised, driven by something other than the stated mechanism, and most damaging when sized by confidence rather than by humility.
Method notes and limitations
- No gold-industry data. Prices are the World Bank’s monthly commodity series; stocks are Ken French’s market return; bonds are the constructed 10-year Treasury from the 60/40 post, validated against IEF at r = 0.99; inflation is FRED’s CPI.
- The sample starts at the end of Bretton Woods and therefore contains exactly one transition from a pegged to a floating gold price. The 1970s surge is partly a one-time repricing of an asset that had been held artificially cheap, and it will not repeat. It is also the single largest contributor to gold’s full-sample record — which argues that even the modest positive result here is overstated.
- Six decades is six observations for the stability test. That is enough to show the optimum moves, not enough to model how it moves.
- Monthly rebalancing back to the target weight. This flatters gold considerably, since rebalancing systematically sells it after run-ups. An unrebalanced sleeve would have done worse.
- No costs, storage, spreads, or tax. Physical gold carries storage costs; gold ETFs charge fees; in the US, gold ETFs are generally taxed as collectibles at a higher rate than stocks. All of these make the real-world result worse than shown, and none are included.
- Nominal 10-year Treasuries as “the 40”. TIPS would change the inflation conclusions substantially and are the more direct comparison for that specific question.
- US dollar perspective throughout. Much of gold’s behaviour is a dollar story, and an investor in another currency would see different numbers.
This is research, not personalised financial advice.
The code
def best_gold_weight(stk, bnd, gld, rf, grid=np.arange(0, 0.51, 0.01)):
    """Gold weight maximising Sharpe, holding stocks:bonds at 60:40."""
    best, bw = -9e9, 0.0
    for w in grid:
        p = (1 - w) * (0.6 * stk + 0.4 * bnd) + w * gld
        s = sharpe(p, rf)
        if s > best:
            best, bw = s, w
    return bw, best


# the whole argument: run it on the full sample, then decade by decade
print(best_gold_weight(d.stocks, d.bonds, d.gold, rf))          # -> 27%
for decade in decades:
    print(decade, best_gold_weight(*decade_slice(decade)))      # -> 50, 0, 0, 50, 10, 50
If you re-run it and get something different, I want to know.