Is Value Investing Dead?
The value factor had a real, significantly negative alpha from 2007-2020, then rebounded hard. The real ETFs show a flatter comeback than the factor does.
AQR and Morningstar have both published on this question, which puts it in unusually good company for a “is X dead” headline — this isn’t a fringe claim. The version worth checking: value’s long-run edge is real, but it “ran out on the eve of the global financial crisis,” with growth beating value for roughly the next thirteen years. That’s a specific, dated claim. This tests it directly, checks whether momentum — which this site already found carries a strong negative tilt against value — explains part of the weakness, and checks whether the real, buyable funds show the same story as the academic factor.
The raw factor, full sample: real, and right at the edge of significance
Ken French’s value factor (cheap-minus-expensive, HML) against the market alone, 1927–2026:
| Value | |
|---|---|
| Annualised spread return | +3.59% |
| Alpha vs. market alone | +3.01%/yr |
| t-statistic (Newey-West) | 2.21 |
Ninety-nine years in, the value premium clears conventional significance — barely. That “barely” is doing a lot of work, and it’s exactly why splitting the sample by era matters more here than in the momentum or small-cap posts, where the full-sample verdict was more clear-cut in one direction or the other.
The specific claim, checked directly: three very different eras
| Era | Annualised spread | Alpha vs. market | t-statistic |
|---|---|---|---|
| Before 2007 (1926–2007) | +4.89% | +4.25%/yr | +2.90 |
| 2007–2020, the “dead” stretch | −5.58% | −7.05%/yr | −2.15 |
| 2021 onward, the comeback | +8.57% | +11.22%/yr | +1.80 |
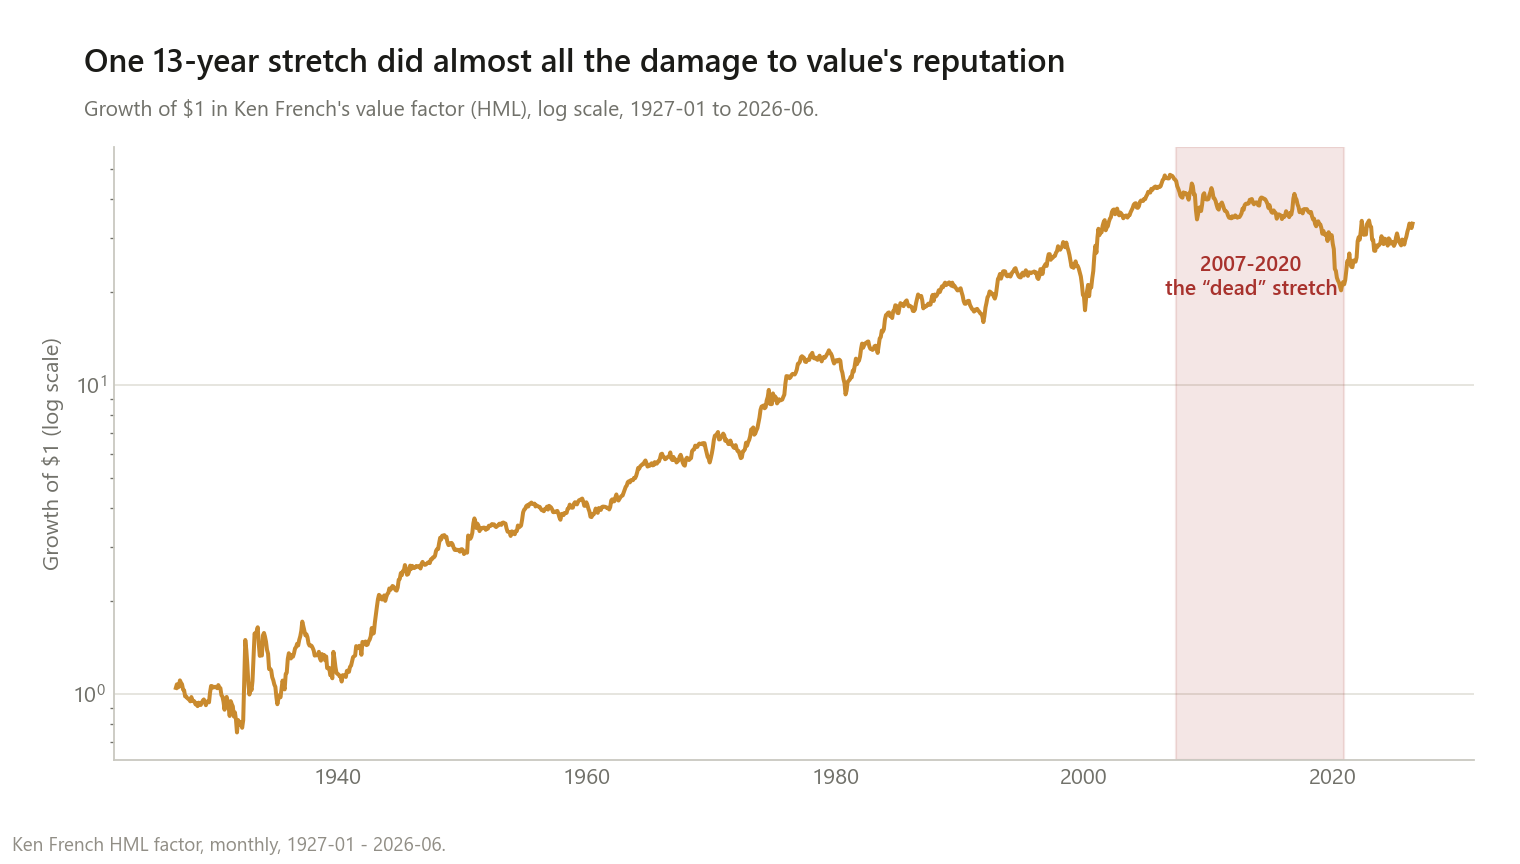
This isn’t a case of a mild claim getting confirmed weakly. Before 2007, value’s alpha was a strongly significant +4.25% a year. From 2007 through 2020, that flips to a significantly negative −7.05% a year — a t-stat of −2.15 means this wasn’t just underperformance, it was underperformance unlikely to be random noise. Then 2021 onward, value comes roaring back at +11.22%/yr, though the shorter sample (66 months) keeps that estimate just short of conventional significance (t=1.80). The AQR/Morningstar framing holds up as a real, dateable, three-act story, not a vague impression.
Momentum explains part of the weakness — value’s version of the same relationship
The momentum post found momentum carries a −0.46 beta to value. From value’s side of that same relationship:
| Value | |
|---|---|
| Correlation, value factor vs. momentum factor | −0.408 |
| Value’s alpha controlling for market + momentum | +5.87%/yr |
| t-statistic | 4.03 |
Controlling for momentum doesn’t just tidy up the number — it nearly doubles value’s alpha (from +3.01%/yr to +5.87%/yr) and pushes the t-stat from a marginal 2.21 to a decisive 4.03. The two factors have spent 99 years partly cancelling each other out in a simple side-by-side comparison, each dragging down what looks like the other’s “true” premium. Dividend growth investing (VIG) shows a milder version of this same anti-value lean — three separate posts on this site now find the same underlying tension between growth-flavored and value-flavored return patterns, from three different angles.
The real, buyable version — and a real discrepancy worth flagging honestly
| VTV (value) | VUG (growth) | SPY | |
|---|---|---|---|
| Annualised (2004–2026, 270 months) | 9.68% | 12.22% | 10.83% |
| Volatility | 14.49% | 16.53% | 14.62% |
| Max drawdown | −54.8% | −47.2% | −50.8% |
| VTV alpha vs. SPY | −0.26%/yr (t=−0.21) | — | — |
Over the real funds’ full live history, value has not beaten the market — a statistically indistinguishable-from-zero alpha, and a cumulative 40.3% gap behind growth (VUG) by the end of the window. That much lines up with the academic factor’s rough wash over the same stretch.
Where it doesn’t line up: since 2021, VTV returned 14.54%/yr and VUG returned 14.57%/yr — essentially identical, no comeback visible at all in the real funds — while the academic HML factor shows a strong +8.57%/yr spread over roughly the same window. I want to flag this plainly rather than quietly pick whichever number tells the cleaner story: the real ETFs and the academic factor are built differently (large-cap Russell/CRSP-style sorts vs. Ken French’s broader methodology), and in this specific recent period they disagree about whether a comeback actually happened. Both numbers are real. They just aren’t measuring quite the same thing.
What this does and doesn’t change
It does mean “value is dead” was, for thirteen specific years, a statistically real observation, not an exaggeration. −7.05%/yr alpha at t=−2.15 is a genuine, significant underperformance, not noise.
It does not mean it’s a permanent condition. The pre-2007 record and the 2021-onward rebound are both real, and the full 99-year alpha (or the momentum-controlled version) still clears significance.
It does mean a chunk of value’s apparent weakness is really “value minus momentum,” not value alone. Controlling for momentum nearly doubled the estimated alpha and roughly doubled the t-stat.
It does mean real fund products and academic factors can tell different short-run stories. The 2021 “value comeback” is unambiguous in Ken French’s data and essentially invisible in the actual VTV-vs-VUG comparison — a reminder that a factor’s academic definition and any specific ETF’s construction are not interchangeable.
Method notes and limitations
- The 2007–2020 and 2021-onward era boundaries are the specific dates AQR/Morningstar coverage attaches to this claim, not a boundary this site chose after seeing the data — tested as given, not fit to look dramatic.
- The 2021-onward sample is short (66 months for the factor, 68 for the funds) — its point estimates are large but its statistical confidence is the weakest of the three eras.
- VTV/VUG use different construction than Ken French’s HML (index-provider style/growth splits on large-caps only, vs. a broader academic sort), which is very likely why they disagree about the 2021 comeback — not a claim that either methodology is wrong.
- Newey-West standard errors, 6 lags, matching the momentum and small-cap posts.
- No transaction costs or taxes. Value strategies generally turn over less than momentum, but this isn’t modelled here.
This is research, not personalised financial advice.
The code
The momentum-controlled regression that nearly doubles value’s estimated alpha:
from ff_data import load_all, regress

dp, ff3, ff5, mom = load_all()
d = pd.concat([ff3, mom], axis=1).dropna()

raw = regress(d["HML"], d[["Mkt-RF"]])              # -> alpha +3.01%/yr, t=2.21
controlled = regress(d["HML"], d[["Mkt-RF", "MOM"]])  # -> alpha +5.87%/yr, t=4.03
Data: Ken French’s HML and momentum factors (same loader as the momentum post), plus real VTV, VUG, and SPY monthly prices (yfinance) since 2004.
If your own era boundaries (a different recession-based split, say, instead of the 2007/2020/2021 dates used here) tell a meaningfully different three-act story, I want to see it — these specific dates came from the claim being tested, not from a search for the cleanest break point.