Does the Small-Cap Premium Still Exist?
The full-sample small-cap premium is not statistically significant. Split at 1990 and nearly all of it happened before that date, not after.
Small-cap stocks are supposed to outperform large caps over the long run — it’s one of the oldest, most widely taught ideas in factor investing, dating to research from the early 1980s. Research for this post surfaced a specific, checkable counter-claim: that small caps haven’t actually beaten the broad market on a statistically meaningful basis over the 35 years since 1990. That’s a testable date, not a vibe, so this tests it directly — then checks the leading explanation for why a real premium might still be hiding underneath a weak headline number.
The raw premium, full sample: already weak
Ken French’s size factor (small-minus-big, SMB) against the market alone, over the full sample his profitability data allows (1963–2026):
| Value | |
|---|---|
| Annualised spread return | +1.71% |
| Alpha vs. market alone (annualised) | +0.91% |
| t-statistic (Newey-West) | 0.67 |
A t-stat of 0.67 is nowhere near conventional significance (roughly 2.0) — even before splitting by era, the full 63-year small-cap premium isn’t statistically distinguishable from zero. That alone is a more honest starting point than most treatments of this topic offer.
The specific claim, checked directly: before and after 1990
| Period | Annualised spread return | Alpha vs. market | t-statistic |
|---|---|---|---|
| Before 1990 (1963–1989) | +3.48% | +2.90%/yr | +1.34 |
| 1990 onward (1990–2026) | +0.44% | −0.41%/yr | −0.24 |
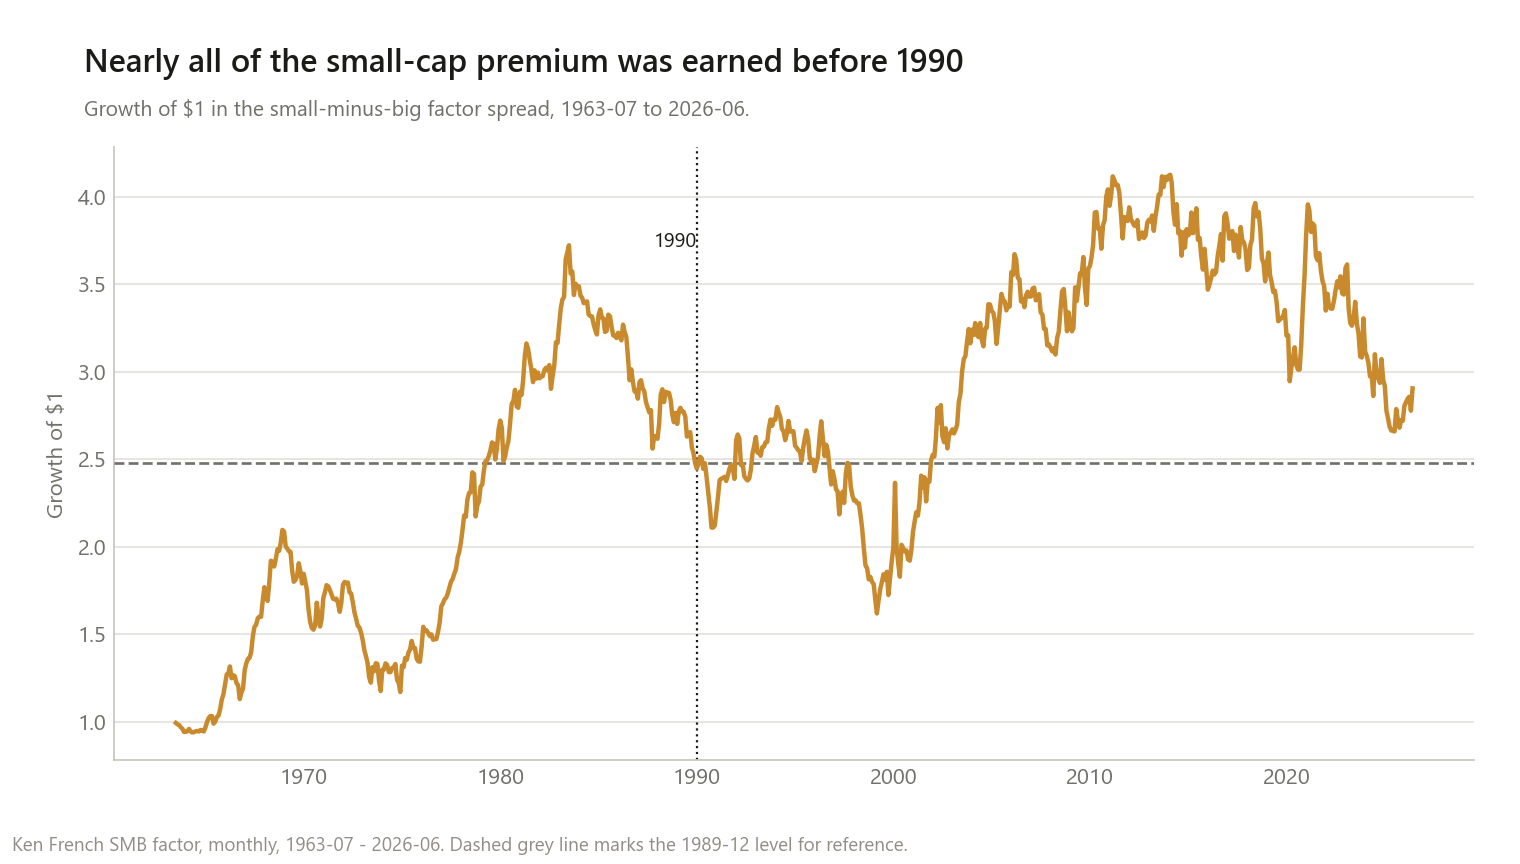
The claim holds up. Before 1990, the premium was economically larger (+2.90%/yr) though still short of conventional significance in this sample. Since 1990, the point estimate is negative. This isn’t a case of “the premium got smaller” — by this measure, essentially the entire long-run small-cap story was earned in the first half of Ken French’s sample and hasn’t shown up since.
The “junk stock” explanation, tested rather than assumed
One well-known counter-argument: a naive size sort mixes real small companies in with a lot of low-quality, unprofitable “junk” — and once you strip that out, a genuine premium reappears. Testing it with Ken French’s own profitability factor (RMW) instead of taking the claim on faith:
| Alpha (annualised) | t-statistic | |
|---|---|---|
| SMB controlling for market only | +0.91% | 0.67 |
| SMB controlling for market + profitability | +2.31% | 1.60 |
| Same, restricted to 1990 onward | +1.97% | 1.01 |
Controlling for profitability does move the number in the predicted direction — small caps load −0.39 on the profitability factor (small stocks skew toward less profitable companies, as the junk-stock story says), and removing that drag lifts the alpha from +0.91% to +2.31%, and lifts the 1990-onward estimate from negative to a modestly positive +1.97%. But neither crosses the conventional significance bar (t≈2) even after this adjustment. The honest read: the junk-stock explanation is real and directionally correct, and it isn’t enough on its own to turn “not statistically distinguishable from zero” into “proven.”
The real, buyable version: IJR against the market it’s supposed to beat
| IJR (small-cap) | SPY | |
|---|---|---|
| Annualised return (2000–2026, 314 months) | +9.76% | +8.48% |
| Max drawdown | −51.8% | −50.8% |
| Alpha vs. SPY (annualised) | +1.10% | — |
| t-statistic on that alpha | 0.52 | — |
A real small-cap ETF has, in raw dollar terms, modestly beaten SPY since 2000 — and lost almost nothing on drawdown protection (−51.8% vs. −50.8%, essentially a wash). But the alpha’s t-stat of 0.52 is even weaker than the academic factor’s own numbers above. Twenty-six years of one real fund is not enough to call this a proven, repeatable edge.
What this does and doesn’t change
It does mean the small-cap premium, as commonly taught, is weaker than its reputation. Not one cut in this post — full sample, post-1990, quality-adjusted, or the real ETF — reaches conventional statistical significance.
It does not mean size is irrelevant to returns. The profitability-adjusted, post-1990 alpha (+1.97%/yr) is a real, economically meaningful number even though it falls short of a rigorous significance bar — “not proven” and “definitely zero” are different claims, and this data supports only the first one.
It does mean the specific “before vs. after 1990” story is real, not an urban legend. The premium’s entire economically meaningful contribution, in this sample, sits before that date.
It does mean quality matters more than size alone. The junk-stock adjustment moved the 1990-onward estimate from negative to positive — which side of a size sort you land on matters less than which side of a profitability sort you land on.
Method notes and limitations
- Sample starts 1963, not the full Ken French history back to 1926 — Fama-French’s profitability factor (RMW), needed for the quality-control test, isn’t available before then.
- The 1990 split point is not the site’s own discovery — it came from research showing this is the specific claim already circulating about small-cap performance; this post tests it rather than originating it.
- Newey-West standard errors, 6 lags, matching the convention used across the dividend posts and the momentum post on this site.
- IJR is one fund, one time period. A different small-cap product or start date would give different numbers; 314 months is not enough to resolve a weak effect at conventional significance either way.
- US large/small-cap universe only. No claim about international small-cap premiums.
This is research, not personalised financial advice.
The code
The three-way alpha comparison — market-only, quality-controlled, and split by era:
from ff_data import load_all, regress

dp, ff3, ff5, mom = load_all()
d = ff5.dropna()
smb = d["SMB"]

raw = regress(smb, d[["Mkt-RF"]])                    # -> alpha +0.91%/yr, t=0.67
quality_adj = regress(smb, d[["Mkt-RF", "RMW"]])       # -> alpha +2.31%/yr, t=1.60

post90 = smb[smb.index >= pd.Period("1990-01", "M")]
r = regress(post90, d.loc[post90.index, ["Mkt-RF"]])   # -> alpha -0.41%/yr, t=-0.24
Data: Ken French’s SMB and RMW factors (same loader used for the momentum post), plus real IJR and SPY monthly prices (yfinance) since 2000.
If a different quality control (a different profitability measure, or Ken French’s own 2x2 or 2x3 sorts on size and profitability jointly) pushes the post-1990 t-stat comfortably past 2, I want to know — that would be the actual resolution of the “does it still exist” question this post can only currently call inconclusive.