Does Momentum Investing Actually Work?
A real, replicable academic premium with a real way to lose 49% in three months. The buyable ETF version barely, not significantly, beats the market.
Most of what ranks for this question today is written for active traders — lookback windows, rotation rules, RSI filters, backtested entries and exits. This asks the version that actually matters for someone deciding whether to put money into a momentum fund: does buying recent winners and avoiding recent losers show up as a real, persistent premium in 99 years of data, does it survive being controlled for the other things it might just be a disguised bet on, did it actually blow up the way its reputation suggests, and would an ordinary investor buying the real ETF have captured any of it.
The academic factor, and a distinction worth getting right
Ken French’s momentum factor is a long-short spread: buy the stocks that have gone up the most over the past year, sell short the stocks that have gone down the most, roughly balance the dollar amounts. Over 1927–2026, that spread returned:
| Annualised return | Annualised volatility | Max drawdown | |
|---|---|---|---|
| Momentum factor (long-short spread) | +6.19% | 16.21% | −78.5% |
| The market itself, for scale | +10.32% | — | — |
Those two numbers are not directly comparable, and conflating them is the single most common mistake in how this factor gets described. The spread is market-neutral by construction — in an idealised, frictionless world it stacks on top of market exposure, it doesn’t substitute for it. A real, buyable, long-only version is section three below. This section is about whether the underlying premium is real at all.
Does it survive being controlled for market, size, and value?
Regressing the momentum spread on the market, size (SMB), and value (HML) factors — the same Newey-West regression this site already uses for the dividend cluster — asks whether momentum is really its own thing, or just a disguised bet on something else already well documented:
| Value | |
|---|---|
| Alpha (annualised) | +11.43% |
| t-statistic (Newey-West, 6 lags) | 8.38 |
| R-squared | 23.4% |
| Beta to market | −0.22 |
| Beta to size (SMB) | −0.06 |
| Beta to value (HML) | −0.46 |
The alpha survives, decisively — a t-stat of 8.38 is not a borderline result. Notice the alpha (+11.43%) is actually higher than the raw spread return (+6.19%): momentum carries a built-in tilt against value stocks (beta −0.46 to HML), and since value has had its own positive average return over this period, that tilt has been a drag on momentum’s raw number. Strip it out and the pure premium is larger than it first looks. Dividend growth investing carries a milder version of the same tilt — this site found VIG-minus-VYM loads on HML at −0.29 — which is a useful reminder that “growth-flavored” strategies of various kinds tend to share this same anti-value lean, not something unique to momentum specifically.
The decade nobody skips when they tell this story honestly
| Decade | Annualised | Worst single month |
|---|---|---|
| 1930s | −6.99% | −52.6% |
| 1990s | +13.63% | −8.9% |
| 2000s | −2.03% | −34.4% |
| 2010s | +2.62% | −8.6% |
| 2020s (through 2026) | +4.63% | −16.2% |
Momentum has had two genuinely bad multi-year stretches — the 1930s and the 2000s — and a weak 2010s on top of that. The five worst months on record: 1932-08 (−52.6%), 1932-07 (−45.6%), 2009-04 (−34.4%), 1939-09 (−31.4%), 2001-01 (−25.4%). Two of the five worst months in 99 years happened within one 90-day stretch:
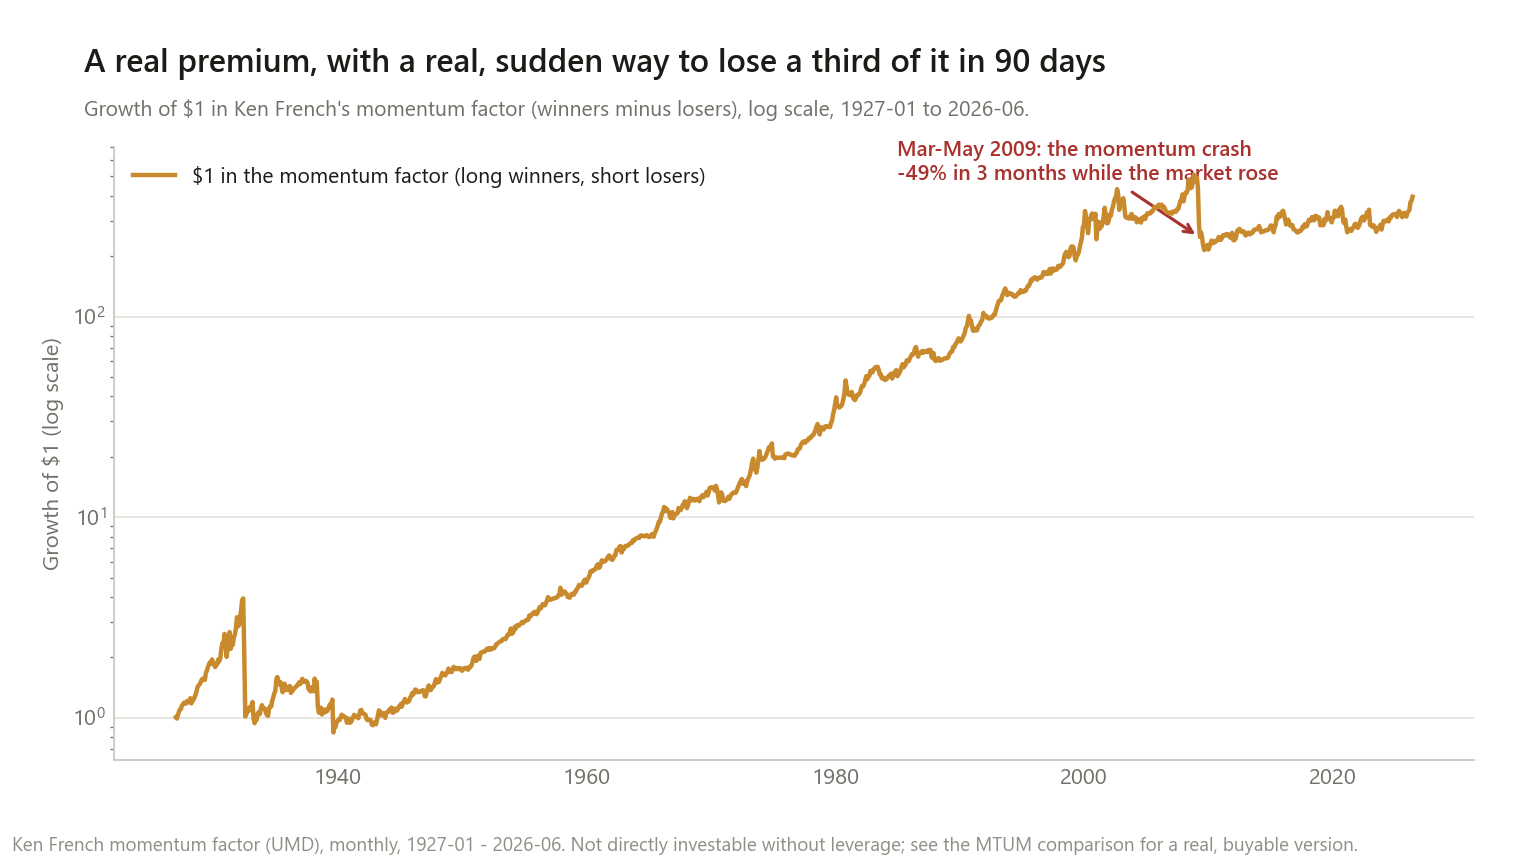
March–May 2009 alone cost the momentum factor −49.4%, while the market itself rose +26.4% over the exact same three months. That’s the momentum crash mechanism in one number: a sharp market reversal off a bottom sends the stocks a momentum strategy is short (recent losers) rocketing up faster than the stocks it’s long, and a long-short book gets hit from both sides at once. It is rare — this is one 90-day stretch out of 1,194 months — but it is not a tail risk you can wave away as theoretical.
The real, buyable version: MTUM against the market it’s supposed to beat
Everything above is an academic long-short spread, not something available in a brokerage account. iShares’ MTUM (launched April 2013) is: a real, long-only momentum ETF, expense ratio 0.15%, holding actual stocks.
| MTUM | SPY | |
|---|---|---|
| Annualised return (2013–2026, 159 months) | +15.48% | +14.34% |
| Max drawdown | −30.2% | −23.9% |
| Alpha vs. SPY (annualised) | +1.56% | — |
| t-statistic on that alpha | 0.72 | — |
MTUM has, in fact, beaten SPY over its live history — by 1.14 percentage points a year. But a t-stat of 0.72 is nowhere close to conventional statistical significance (roughly 2.0), on a sample of a little over 13 years. Compare that to the academic factor’s t-stat of 8.38 over 99 years, and the honest read is: the long-run academic case for momentum is strong; the live track record of the one real fund built on it is short, noisy, and not distinguishable from luck yet. MTUM also hasn’t delivered the downside protection its “quality” reputation might suggest — its max drawdown (−30.2%) has actually been worse than the plain S&P 500’s (−23.9%) over the same period, which included the 2020 and 2022 drawdowns.
What this does and doesn’t change
It does mean momentum is one of the more robust findings in this literature. A century of data, a t-stat over 8 after controlling for market, size, and value — this isn’t a fragile, data-mined result.
It does not mean it’s a smooth ride. The same regression that proves the premium is real also sits on top of a −78.5% drawdown in the raw spread, and two of history’s five worst months arrived in one 90-day window.
It does not mean the real, investable product has proven itself yet. Thirteen years of MTUM is a genuinely short sample for a strategy whose own academic record spans a century — the fund’s modest edge over SPY so far is real in dollars, unproven as a repeatable pattern, and hasn’t come with less downside.
It does mean momentum and value pull in opposite directions. The −0.46 HML beta here is a specific, checkable number, and something to know before combining a momentum tilt with a value tilt in the same portfolio expecting them to simply add together.
Method notes and limitations
- The academic factor is long-short and not directly investable without leverage, shorting costs, and financing that this simplified series doesn’t model — a real reason it isn’t directly comparable to the market return, beyond just being a different kind of number.
- No transaction costs or taxes are modelled in the academic factor. Momentum is a high-turnover strategy by construction (this month’s winners are frequently not next month’s), which in a taxable account would create meaningfully more short-term-gain drag than the tax-drag post found for a low-turnover dividend portfolio — not measured here, but worth flagging before assuming the academic number is what you’d keep.
- MTUM is one fund, one time period. A different momentum product, launch date, or rebalancing methodology would show different numbers; 159 months is not enough to distinguish a real edge from noise at conventional significance either way.
- Newey-West standard errors, 6 lags, matching the convention already used for the dividend posts on this site.
- US large/mid-cap universe (Ken French’s standard sample). No claim about momentum in small caps, international markets, or other asset classes.
This is research, not personalised financial advice.
The code
The alpha regression, reusing the same Newey-West helper this site’s dividend posts already validated:
from ff_data import load_all, regress

dp, ff3, ff5, mom = load_all()
d = pd.concat([ff3, mom], axis=1).dropna()

res = regress(d["MOM"], d[["Mkt-RF", "SMB", "HML"]])
# -> alpha +11.43%/yr, t=8.38, betas: Mkt -0.22, SMB -0.06, HML -0.46
Data: Ken French’s momentum factor (same loader used for the dividend cluster), plus real MTUM and SPY monthly prices (yfinance) since MTUM’s 2013 launch.
If your own out-of-sample fund comparison shows a t-stat comfortably above 2, I’d want to know which fund and which period — that would be the first real statistical confirmation this specific product has earned its academic pedigree.